© 2011 Thorlabs
105Operating the Beam Profiler
In the case of a focussed beam, the hyperbolic data fit is recommended. In addition
to this fit selection the program is able to identify a coarse beam gradient. If the M²
measurement is chosen but the beam shows a linear slope with a beam width
variation of less than 50% the Beam software will suggest a linear fit.
If the program detects a (unfocussed) linear beam propagation instead of a
(focussed) hyperbolic one the software will recommend to proceed with Divergence
measurement perform a linear fit to the data points.
Toolbar
Opens the settings for the M
2
measurement
Starts / stops a M
2
measurement
Disables/Enables the grid in the diagram
Toggles between a line and dots diagram for the plotted
data
Opens a window extension with a legend and results panels
In the case of a successful M2 measurement this button
enabled and saves plot data.
Saves the results of a M
2
measurement into a PDF file
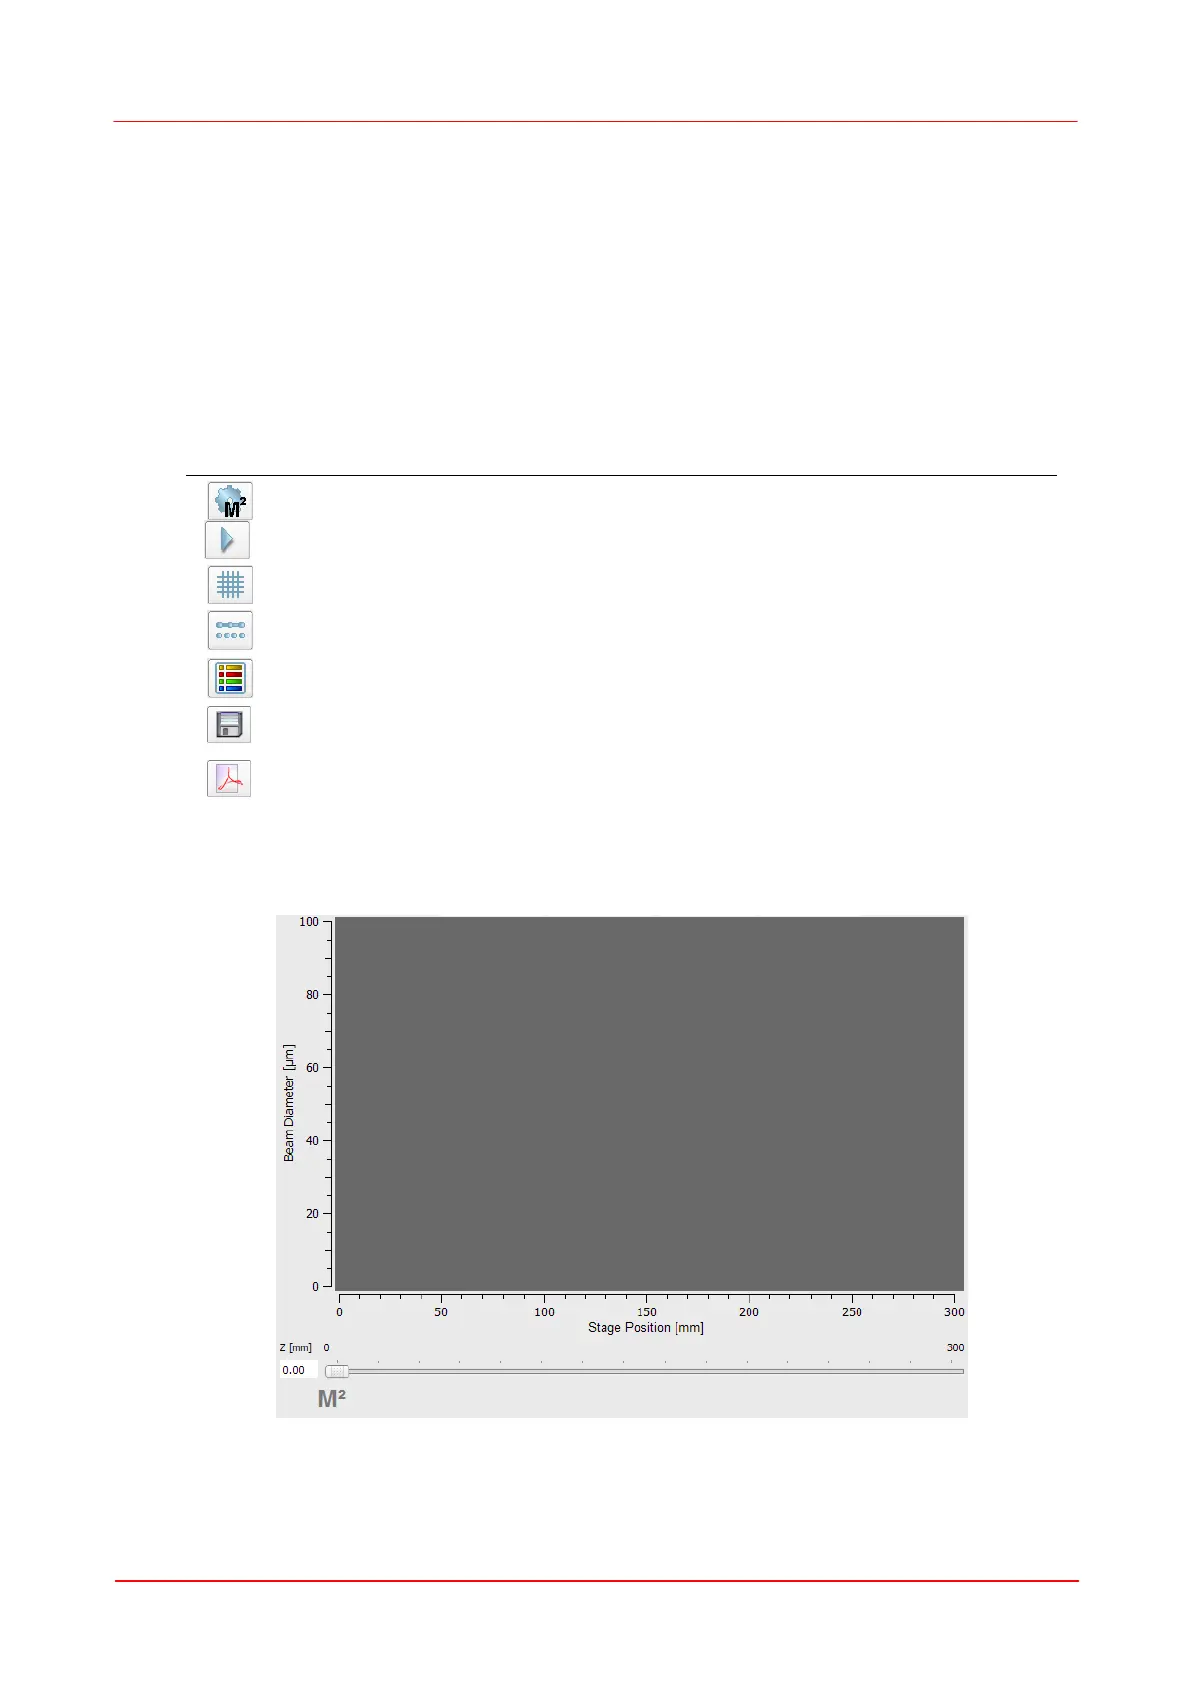
In the diagram (which is of course empty at the beginning) the measured data are
plotted.
The Position Bar at the bottom shows the actual position of the translation stage as
seen before in the Initialize tab.
 Loading...