© 2011 Thorlabs
43Operating the Beam Profiler
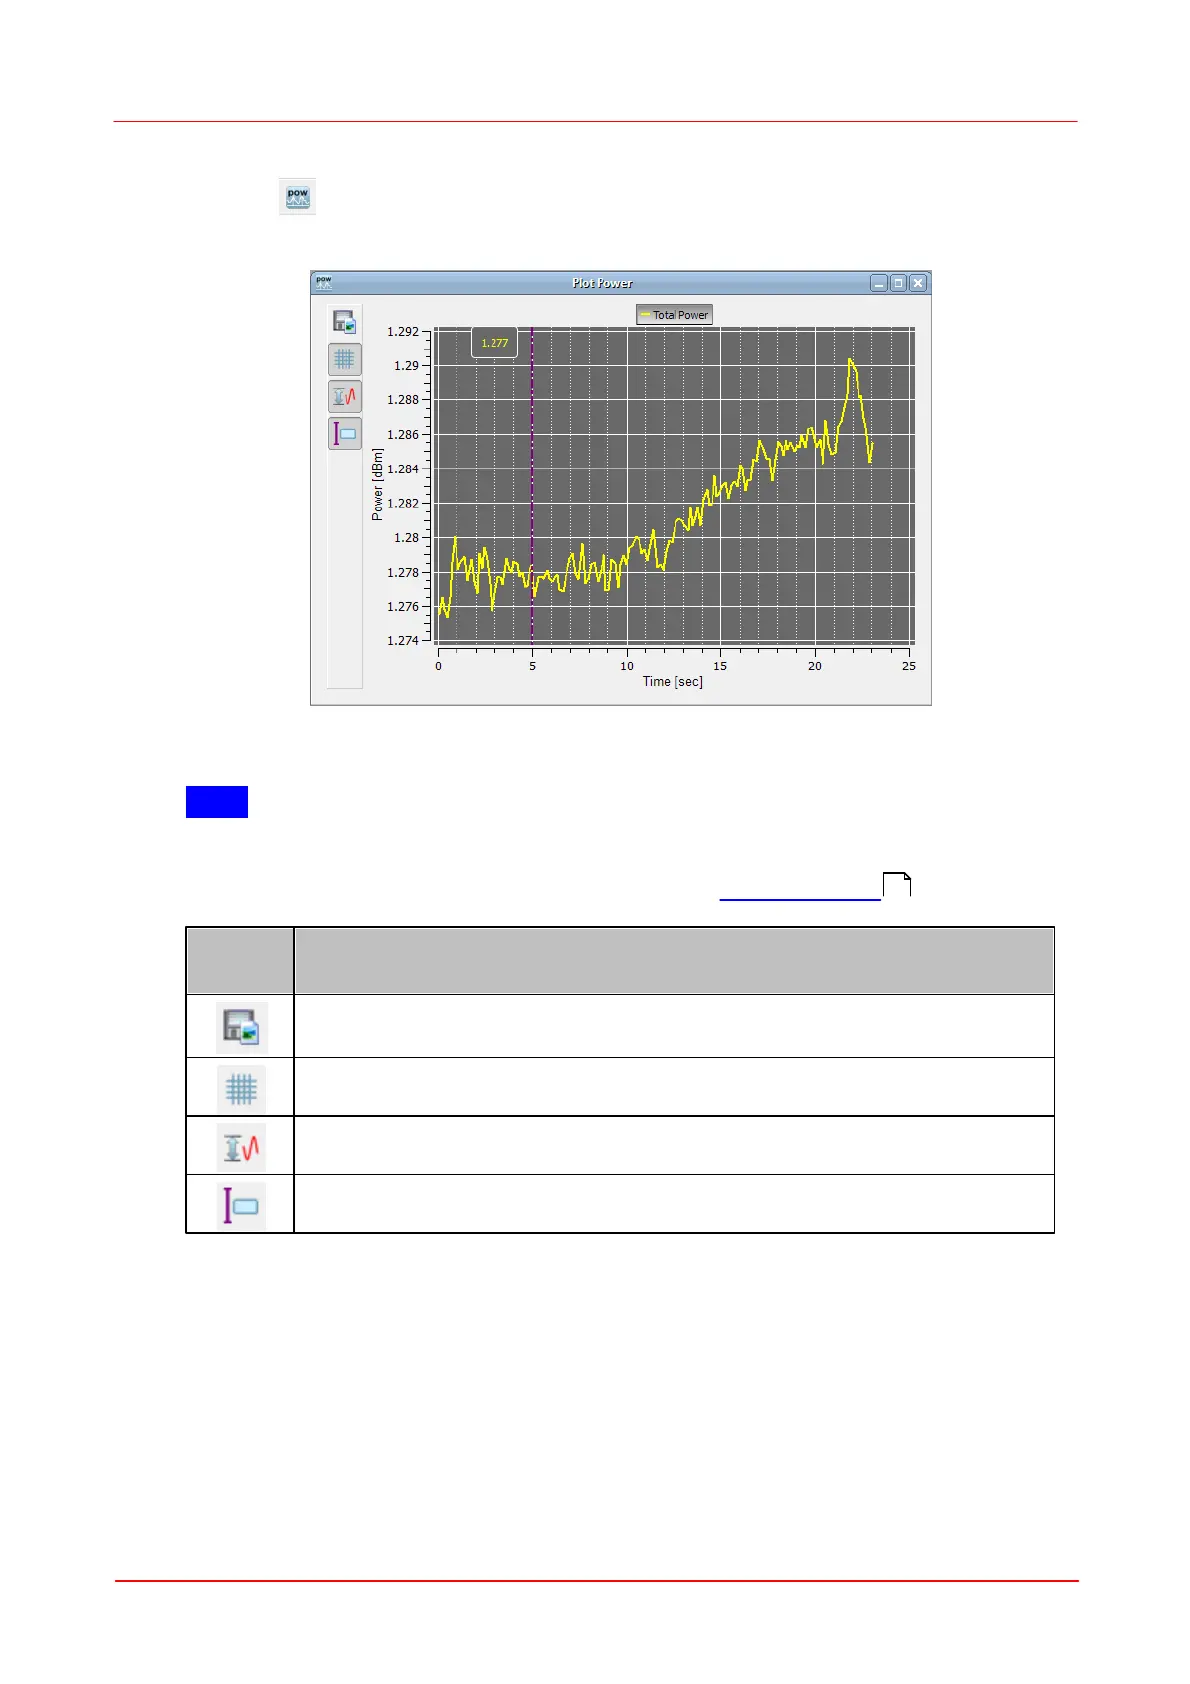
3.3.2.5.2 Plot Power
Toolbar:
Menu bar: Windows -> Plot Power
The total power measured by the beam profiler vs. time can be displayed.
Note
Thorlabs Beam Profiler instruments are not calibrated for power wavelength
dependent. The power calculation is based on a typical responsivity curve of the
used sensor and manually entered wavelength (see Device settings )
Opens a dialog box to specify the properties of the saved screenshots /
diagrams.
Toggle button to display grid in the diagram.
50