© 2011 Thorlabs
36 Thorlabs Beam 4.0
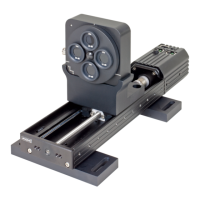
Independent of the selected unit (pixel or µm) within the Application Settings panel
(see Application Settings ) the origin of the coordinate system is the selected
reference position. Horizontal axis is X and vertical axis is Y. Both axes are also
labeled onto the Beam Profiler housing.
3.3.2.2
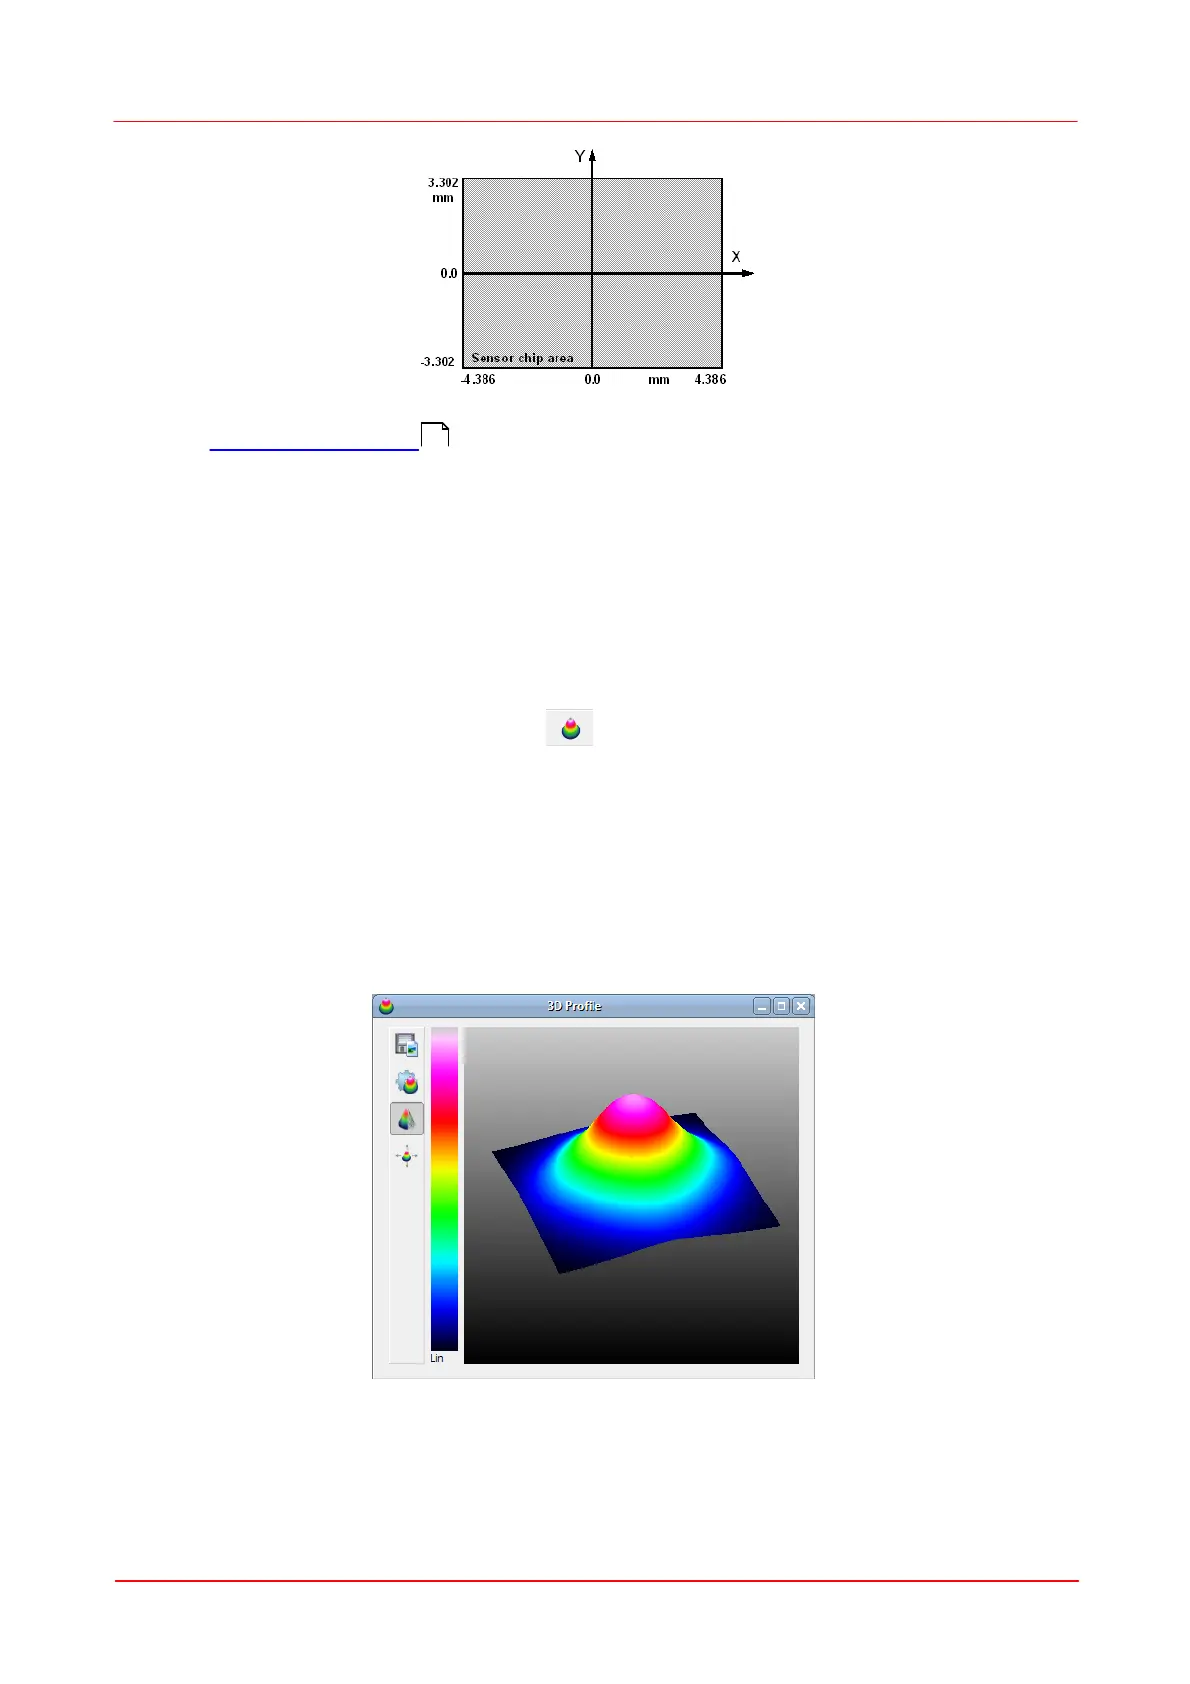
3D Profile
The 3D Profile illustrates the power density distribution of the measured optical
beam. Whereas the beam's cross-section is parallel with the x-y-plane the relative
power intensity is shown in the z direction (Pseudo 3D).
This window can be opened and closed via the menu item "3D Profile" in the
window menu or via the toggle button in the toolbar. It can be closed via the X
button in the upper right corner of the child window.
The 3D profile can be moved, rotated and zoomed with the mouse interaction in the
window. Instructions how to manipulate the displayed graph within the window
Rotate: Press right mouse button and move mouse
Move: Press left mouse button and move mouse
Zoom: Scroll mouse wheel
The following table summarizes the toolbar symbols available within the 3D Profile
window and its appropriate action.
59