© 2011 Thorlabs
42 Thorlabs Beam 4.0
Cursor mode: If the mouse position is near to the vertical cursor line, the
mouse cursor changes to . The cursor line can be moved with the left mouse
button pressed to a position inside the diagram. The current values at the
cursor position are shown in a rectangle next to the cursor in the colors of the
plotted curve.
Below the individual plot windows are explained in detail.
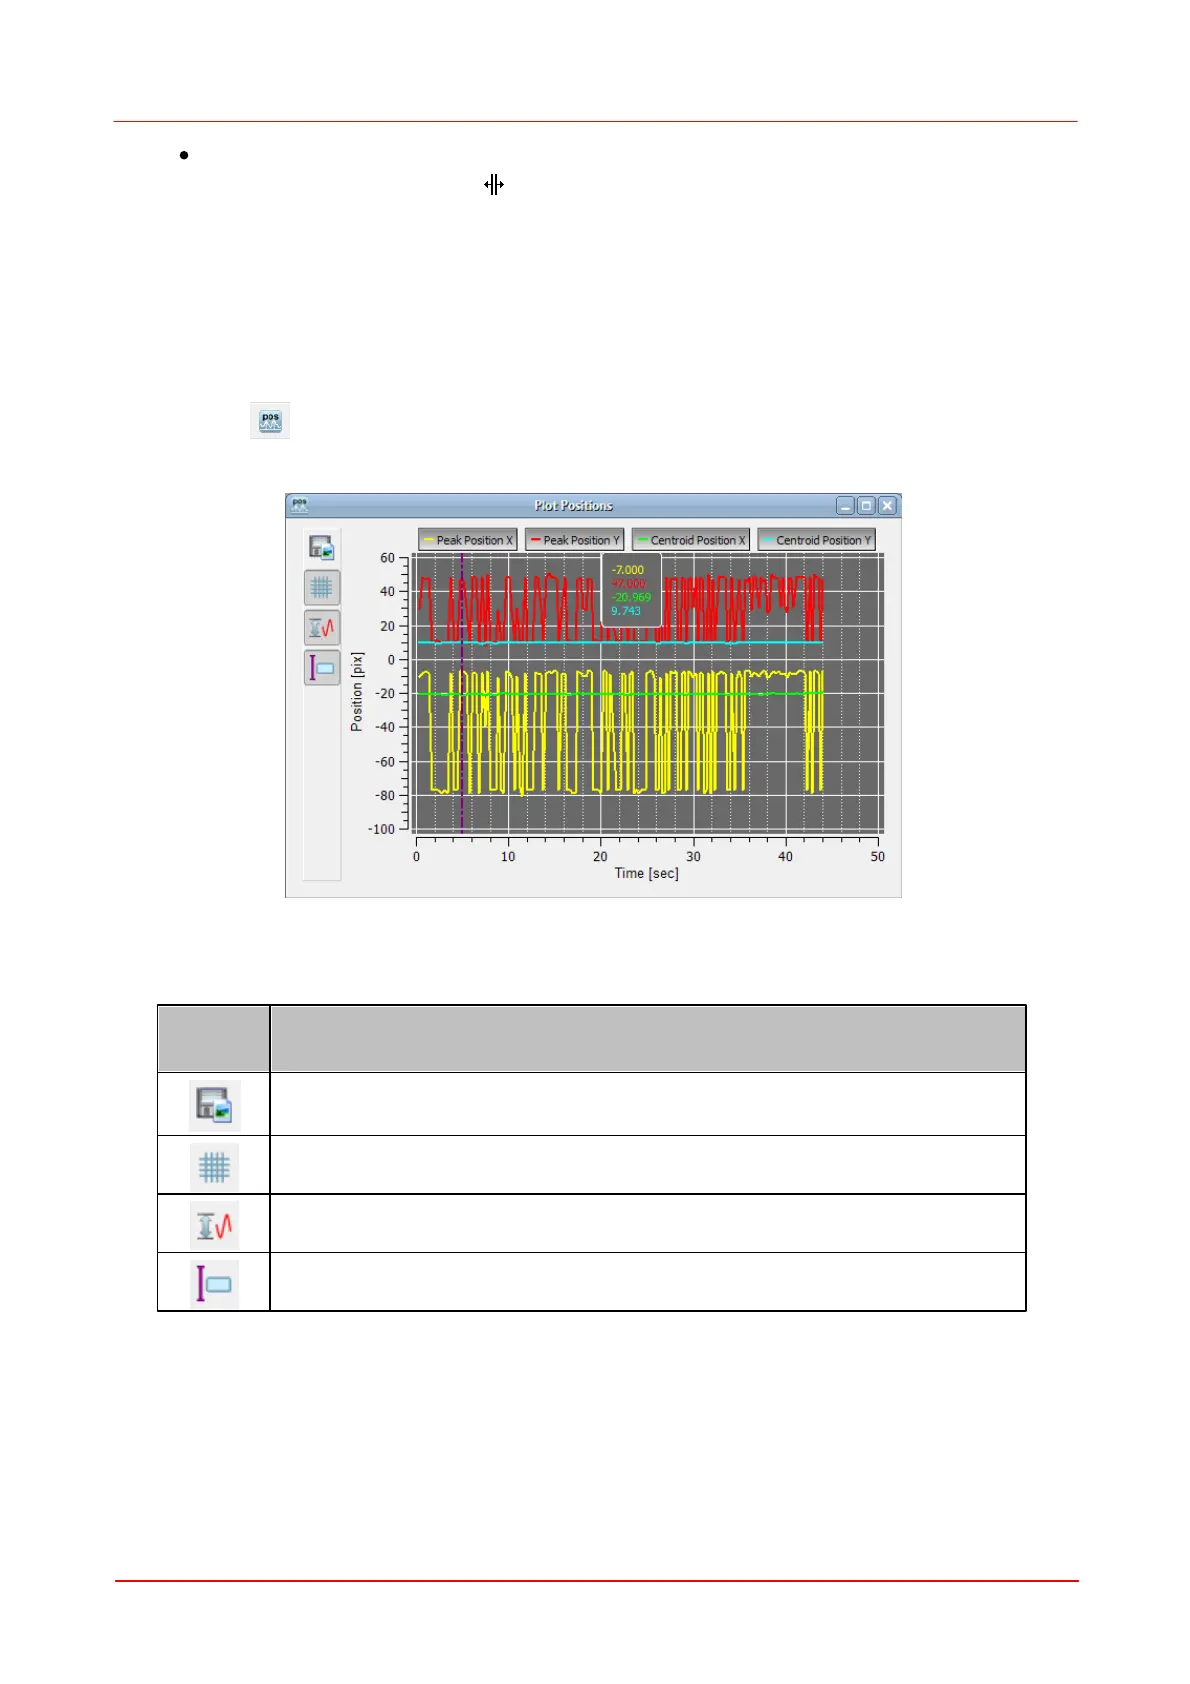
3.3.2.5.1 Plot Positions
Toolbar:
Menu bar: Windows -> Plot Positions
The positions of X and Y peak and of X and Y centroid positions can be displayed
vs. time.
Opens a dialog box to specify the properties of the saved screenshots /
diagrams.
Toggle button to display grid in the diagram.