© 2011 Thorlabs
31Operating the Beam Profiler
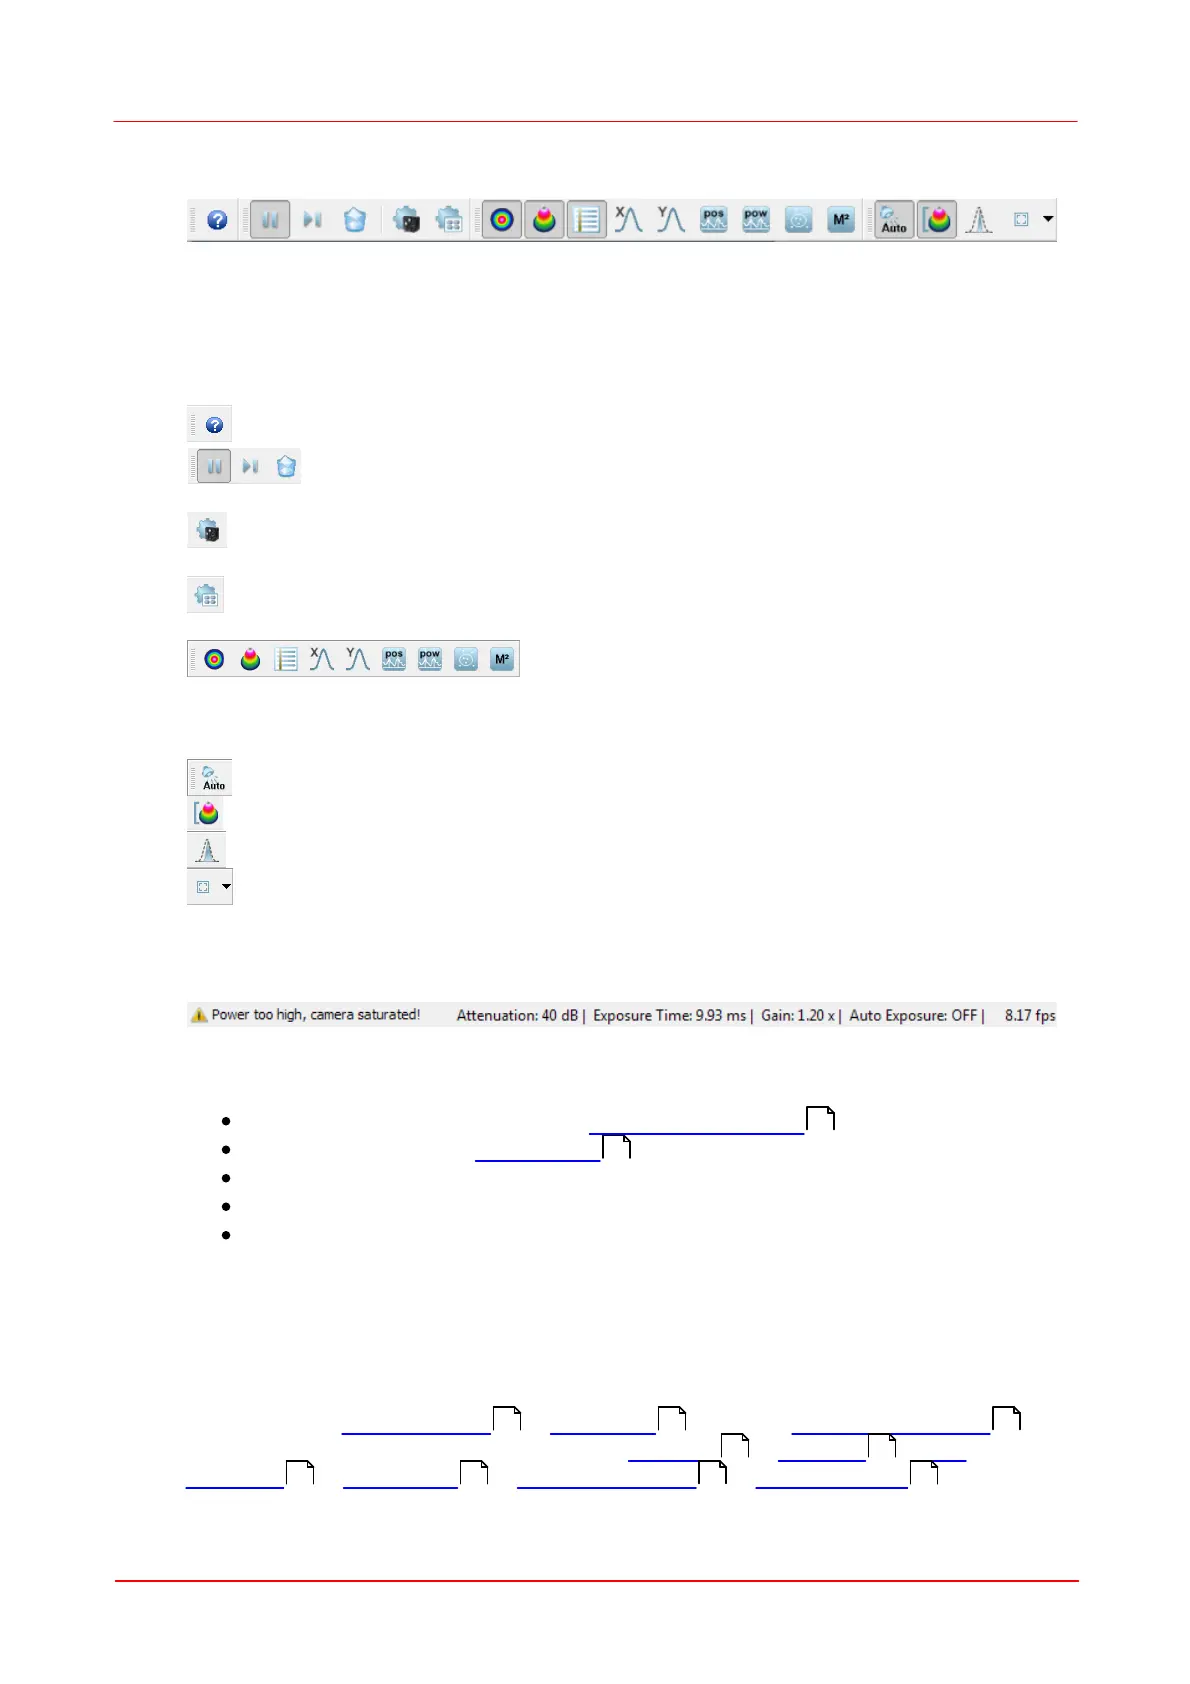
B. Toolbar
For the most important menu entries there are also symbols provided in the tool bar.
Clicking on a toolbar symbol will have the same effect as clicking on the original
menu entry. Moving the mouse over the icons, a tool tip will be displayed.
The toolbar symbol have the following meaning:
Open the online help file
Pause and start the continuous device operation, take a single
measurement and clear the content of each window
Open the device settings panel concerning the Beam Profiler
instrument
Open the application settings panel concerning the GUI and
calculation settings
Open or close the GUI window 2D Profile, 3D Profile,
Calculation Result, X-Y Profiles, Plot Position and Plot Power,
Beam Stability and Beam Quality Measurement.
Toggle Auto Exposure On/Off
Toggle Auto Scale To Peak On/Off
Toggle Max Hold On/Off
Change ROI (Region Of Interest) dimensions
C. Status bar
The status bar is used to display important status information about the Beam
Profiler concerning
Errors and warnings, see chapter Warnings and Errors
Attenuation setting (by Filter Wheel or external attenuator)
Camera settings like Exposure Time and Gain
Current refresh rate of the application in frames per seconds (fps)
Alternatively, if stored Device Data are loaded, the location of the file is
displayed
3.3.2
Child Windows
If the application starts the first time, three child windows are opened and arranged
automatically: "2D Projection ", "3D Profile " and the "Calculation Results ".
The application provides further windows: "X Profile ", "Y Profile ", "Plot
Positions ", "Plot Power ", "Plot Gaussian Fit ", "Beam Stability " and "
132
9
33 36 39
37 37
41 43 44 46