© 2011 Thorlabs
112 Thorlabs Beam 4.0
the M² measurement settings and the toolbar. This prevents the modification of
settings during a measurement.
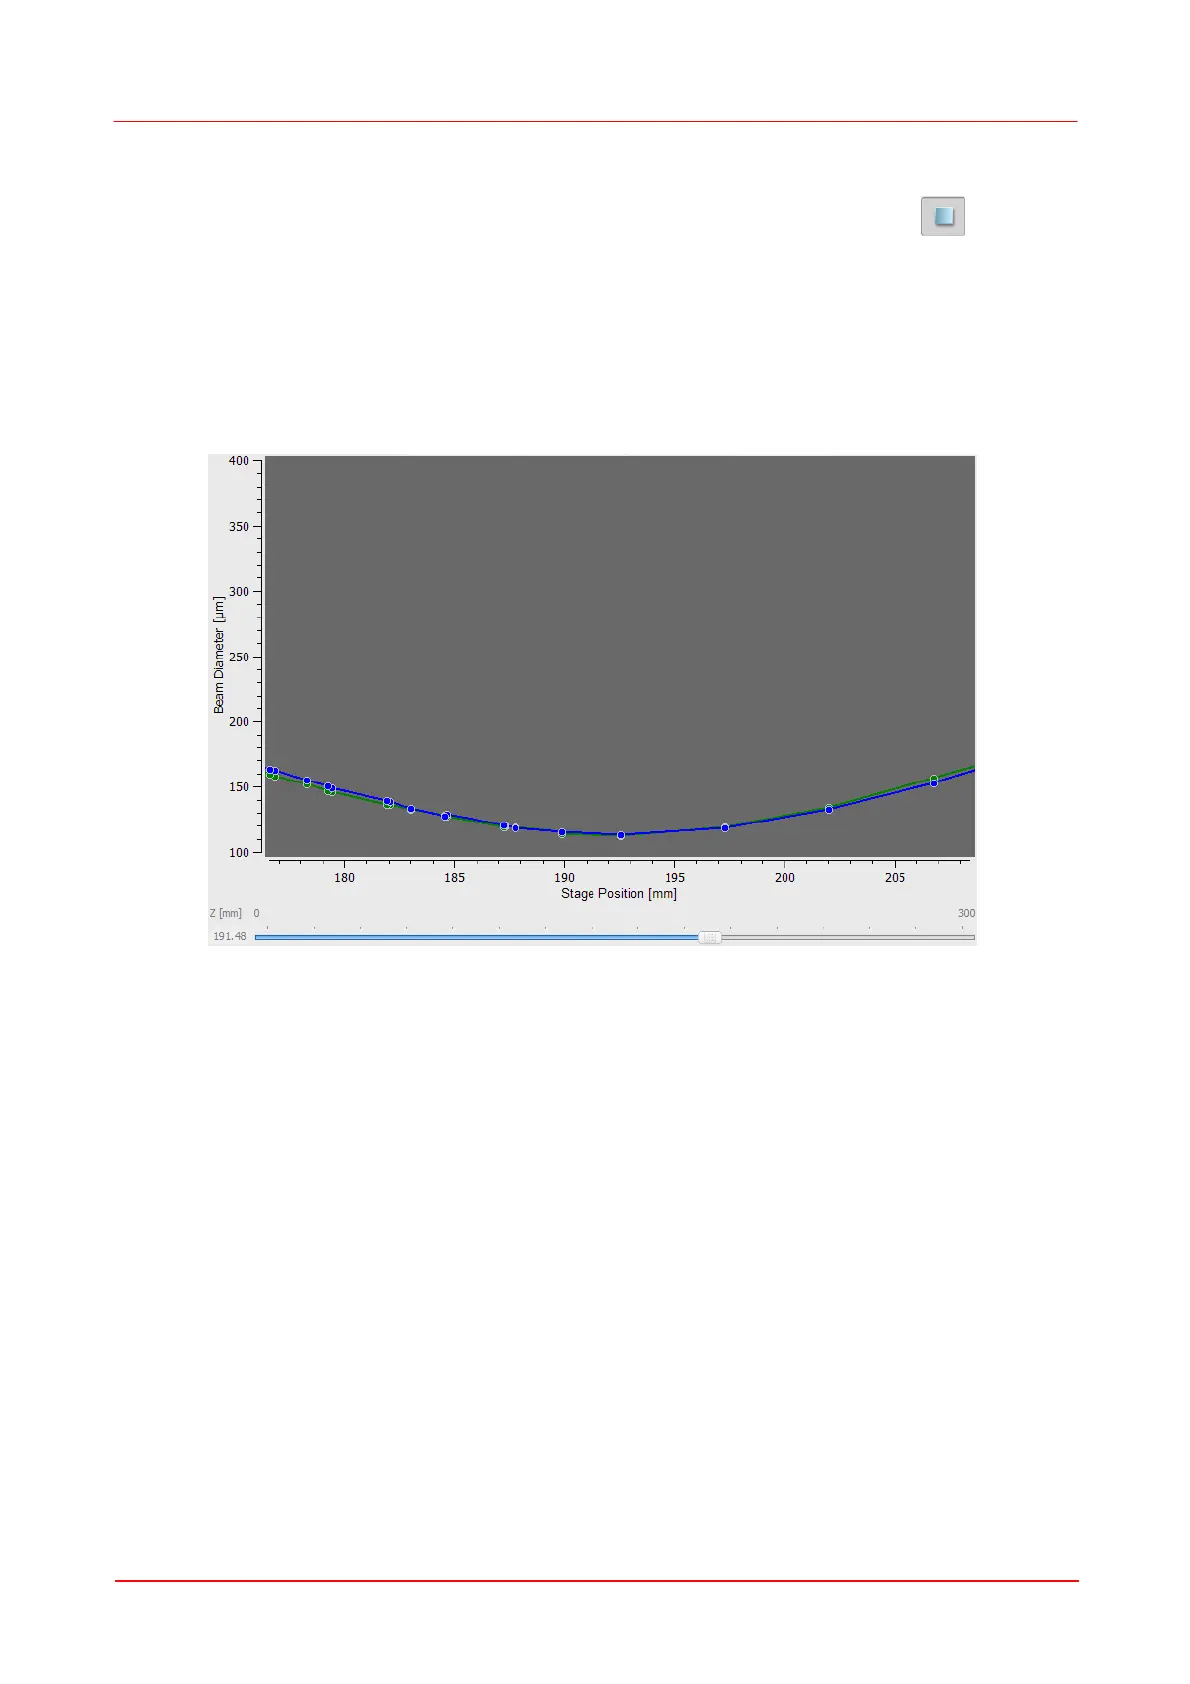
If necessary, the measurement can interrupted by clicking the Stop button .
After starting the measurement the X axis of the diagram is adapted to the user-
defined scan range, for example from 0 to 120 mm. The Y axis scales automatically
to the recorded beam widths.
If the Normal Scan is applied the diagram is zoomed in when the fine scanning
adds additional data points. After this step (at the end of the measurement) the full
scan range is shown again.
3.5.6.6
Numerical Results
If a M
2
measurement was successful the Beam Quality Measurement window
looks like the one below.
 Loading...