© 2011 Thorlabs
120 Thorlabs Beam 4.0
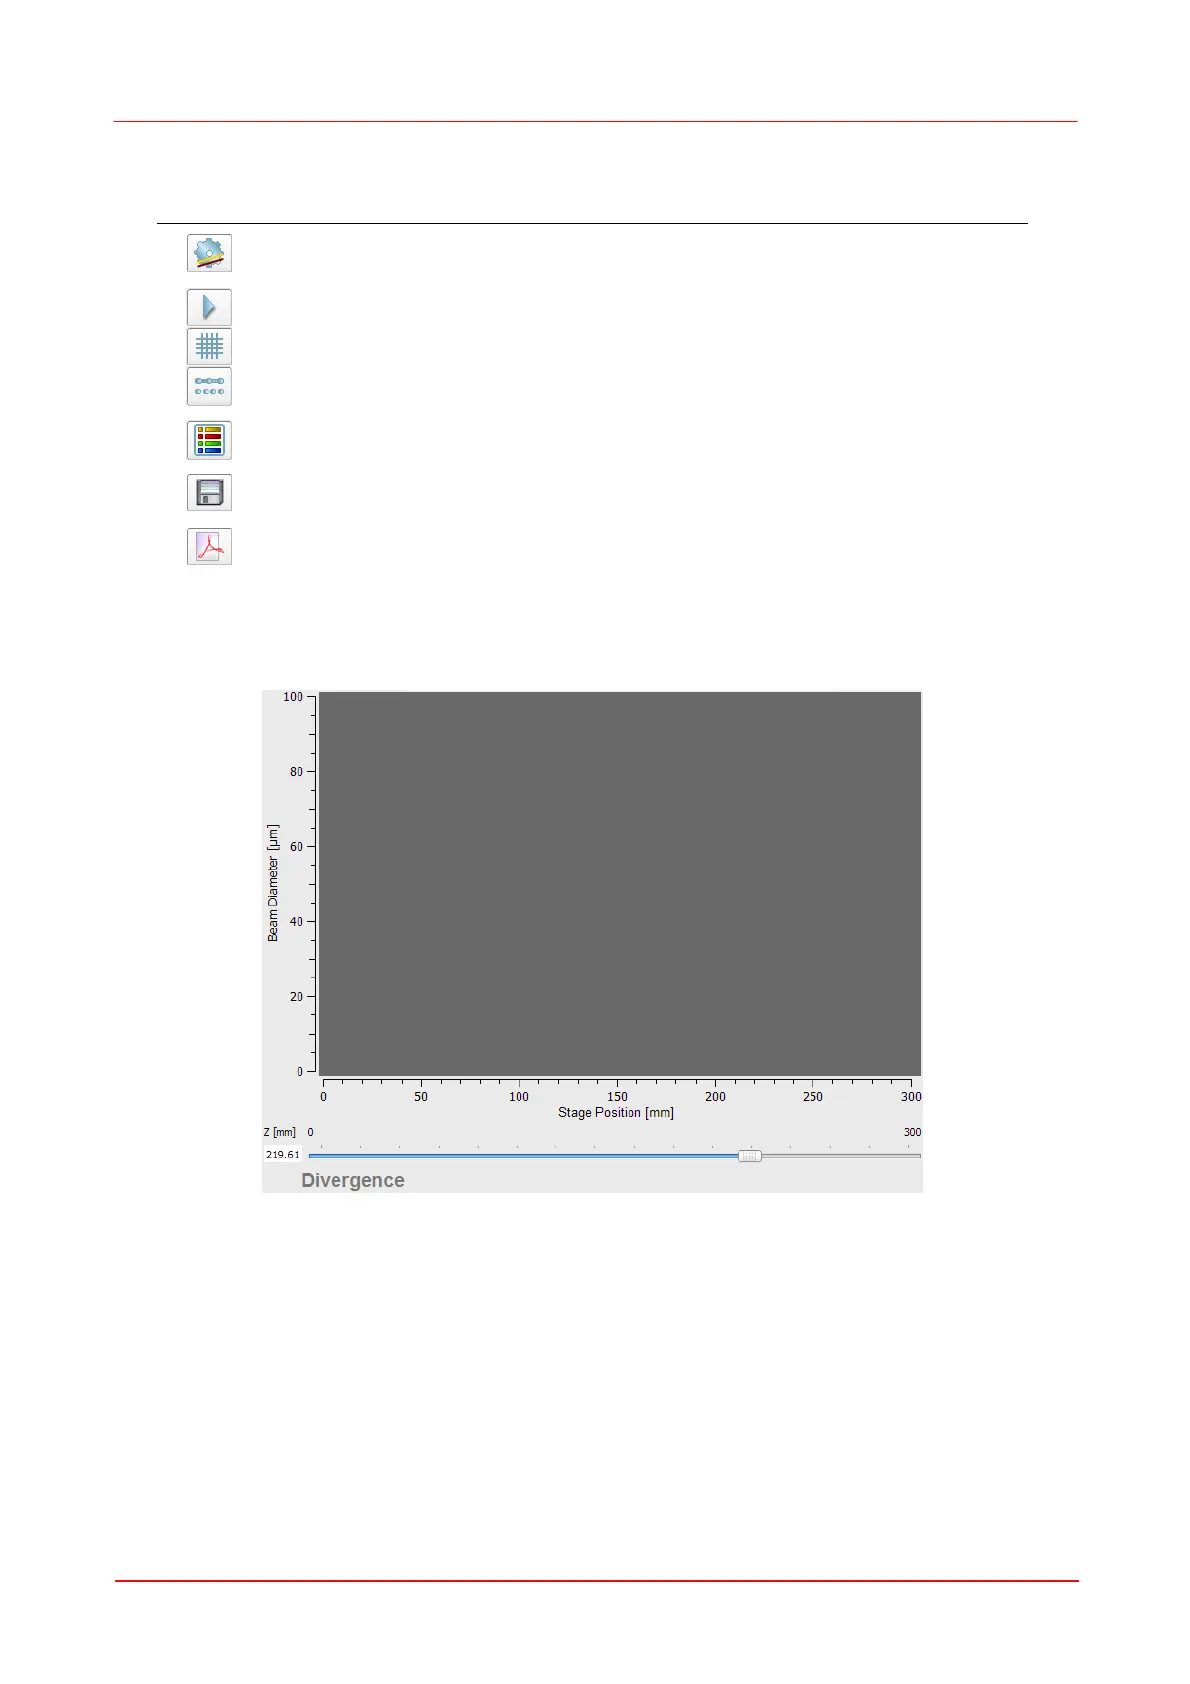
provide the following functionality.
Opens the settings for the Divergence measurement
Starts / stops a Divergence measurement
Disables/Enables the grid in the diagram
Toggles between a line and dots diagram for the plotted
data
Opens a window extension with a legend and results
panels
In the case of a successful divergence measurement this
button enabled and saves plot data.
Saves the results of a divergence measurement into a
PDF file
In the diagram (which is of course empty at the beginning) the measured data are
plotted.
The Position Bar at the bottom shows the actual position of the translation stage as
seen before in the Initialize tab.
On the right side of the diagram the Calculation To Actual Z Position and the
Results of the M
2
measurement are displayed; the boxes are empty so far no
measurement has been made yet.
 Loading...