© 2011 Thorlabs
38 Thorlabs Beam 4.0
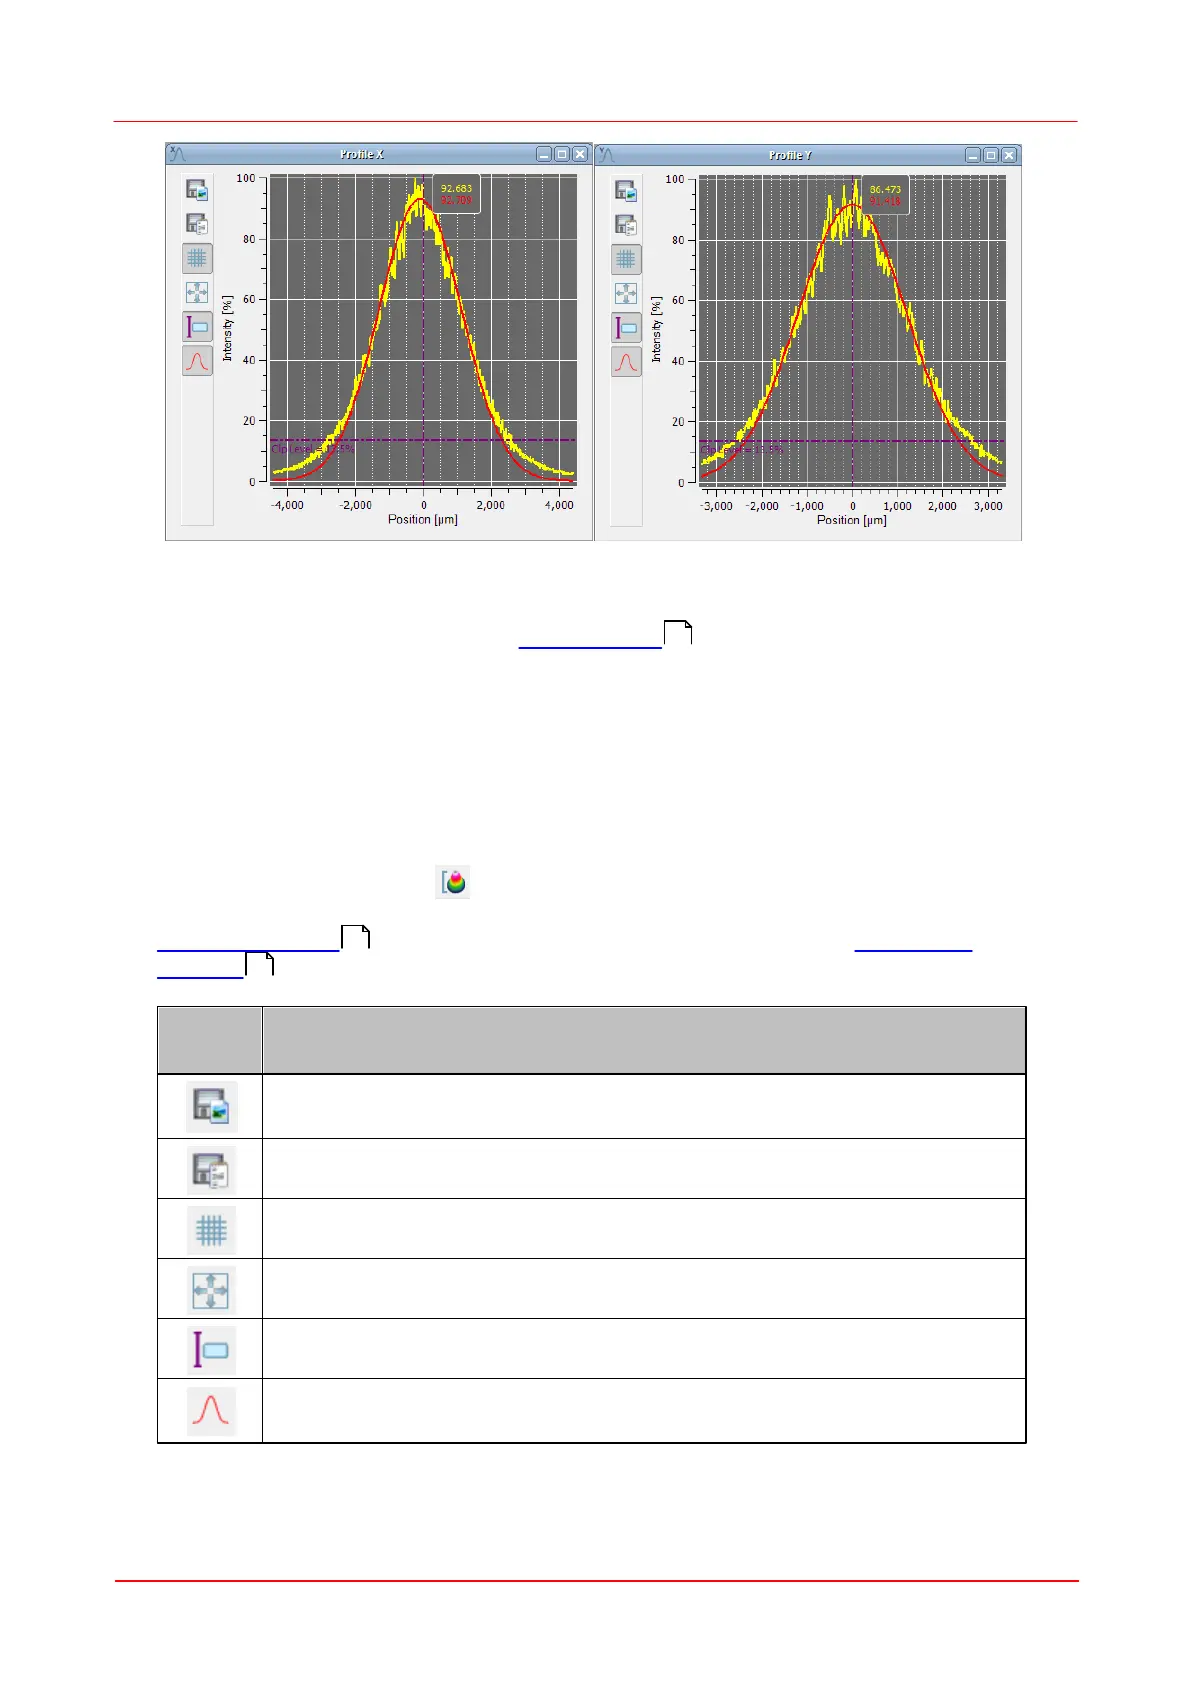
The X profile displays a single pixel row taken from the received camera image,
whereas the Y profile shows a single pixel column. The column and row is defined by
the position of cross hair within the 2D Projection graph.
The yellow graph shows the measured profile, while the red curve shows the
approximated Gaussian fit function. If "Autoscale to Peak" is enabled and in 2D
projection the cross hair is fixed to peak, the measured curve shows relative
intensities from 0 to 100%, where 100% denotes the maximum value in the selected
row / column. The amplitude of the Gaussian fit curve may be lower or even higher
than the peak intensity of the measured curve.
The selected clip level (default 13.5%) is displayed, if the "Auto Scale to Peak"
function is enabled (button ).
The horizontal scale is displayed in pixels or µm and its range refers to the selected
Region of Interest . The unit of the scale can be changed with the Application
Settings dialog.
Opens a dialog box to specify the properties of the saved screenshots /
diagrams.
Opens a dialog box to save measurement data to XLS or CSV file.
Toggle button to display grid in the diagram. Default: grid is shown.
Toggle button to show or hide the cursor.
Toggle button to show or hide the Gaussian curve fit. Default: curve fit is
shown.
Zoom Mode
33
53
59