36: Configuring SLA reporting on Monitor
_______________________________________________________________________________________________________
_____________________________________________________________________________________________________
© Virtual Access 2017
GW1000 Series User Manual
Issue: 1.9 Page 341 of 350
The following graph options are available in the drop-down menu in the name column:
Error Count (Average)
Signal Strength (Average)
Error Count (Max)
Signal Strength (Max)
Error Count (Min)
Signal Strength (Min)
Bytes Transmitted
Bytes Received
Bytes Transmitted over Received
Online time
Temperature (Min)
Temperature (Max)
Temperature (Average)
Select a graph name and then select a relevant range from the following options:
Year
Month
Week
Day
Click Add and when you have selected all graphs, click Save.
View reports
To view a report, in the header menu, select Statistic Reports.
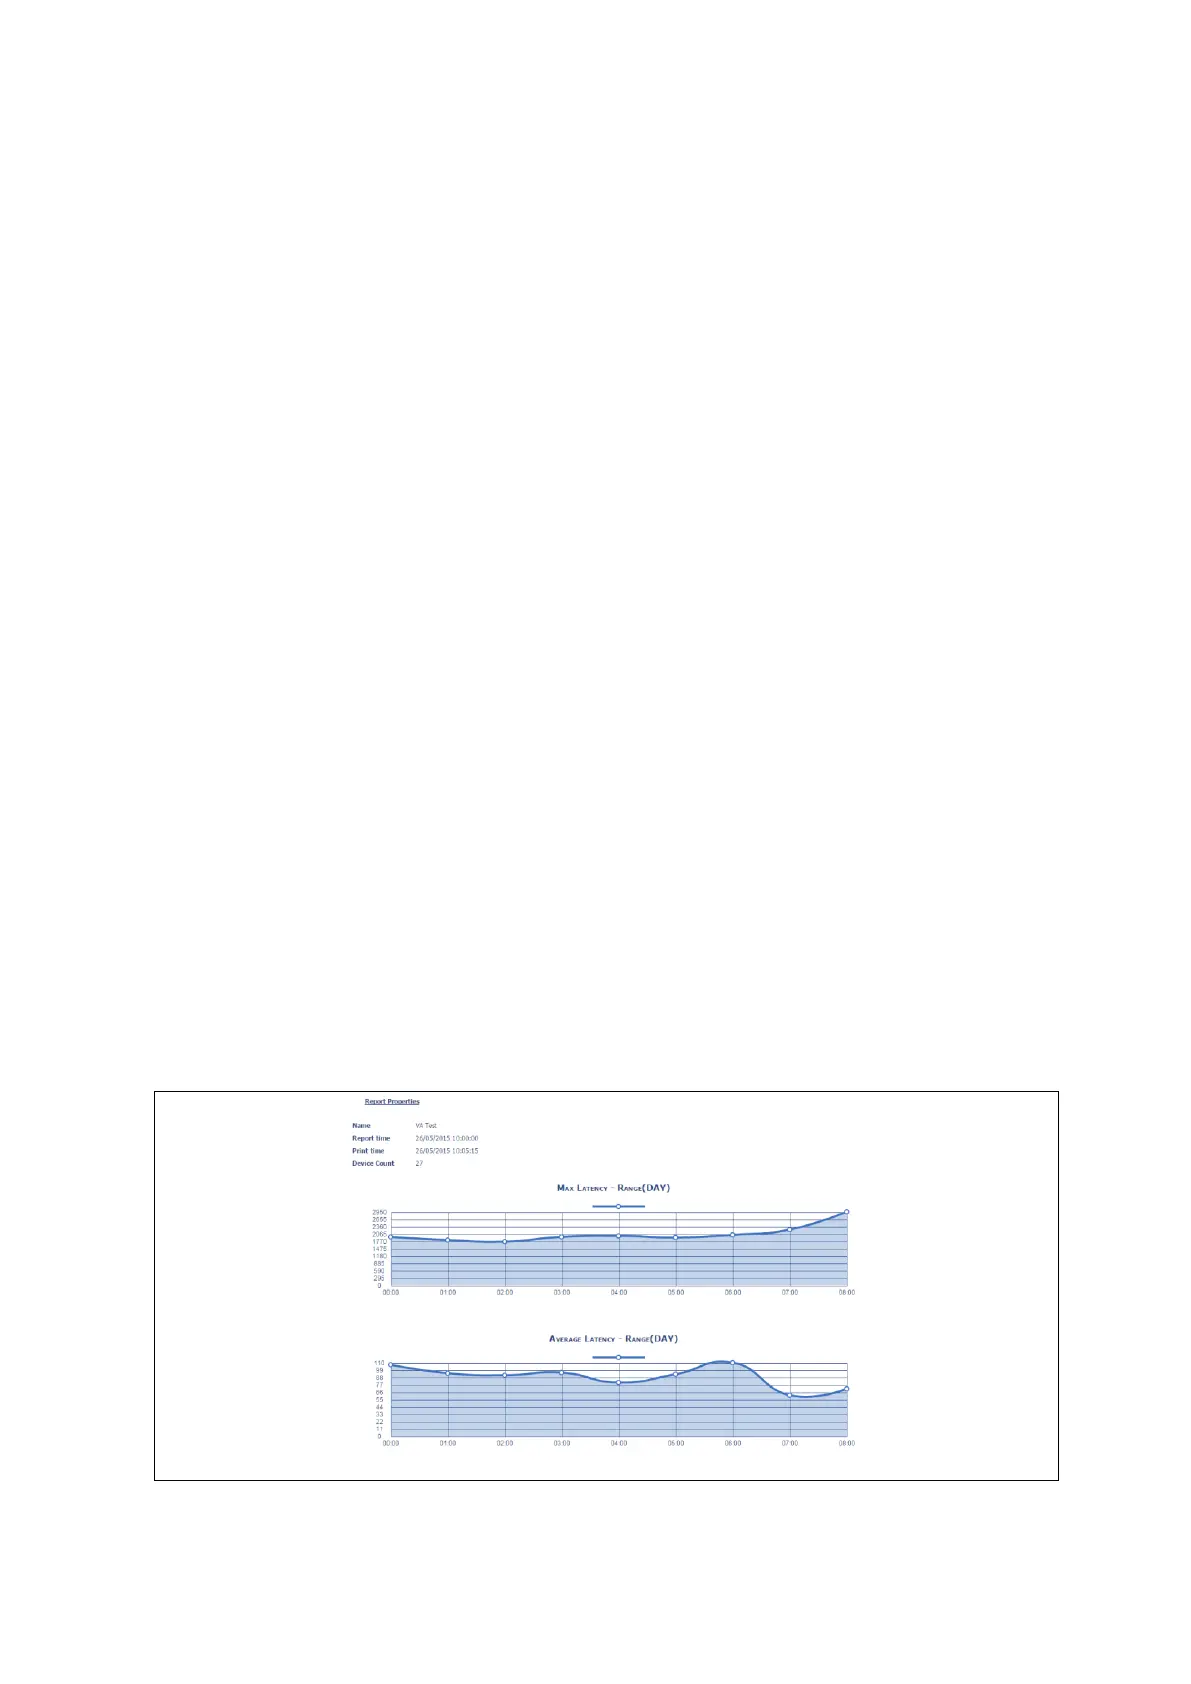
From the drop down box, select the relevant report and click Generate. The report
appears.
Figure 169: Example of a completed report
 Loading...