Spartan-6 FPGA PCB Design and Pin Planning www.xilinx.com 35
UG393 (v1.1) April 29, 2010
PDS Measurements
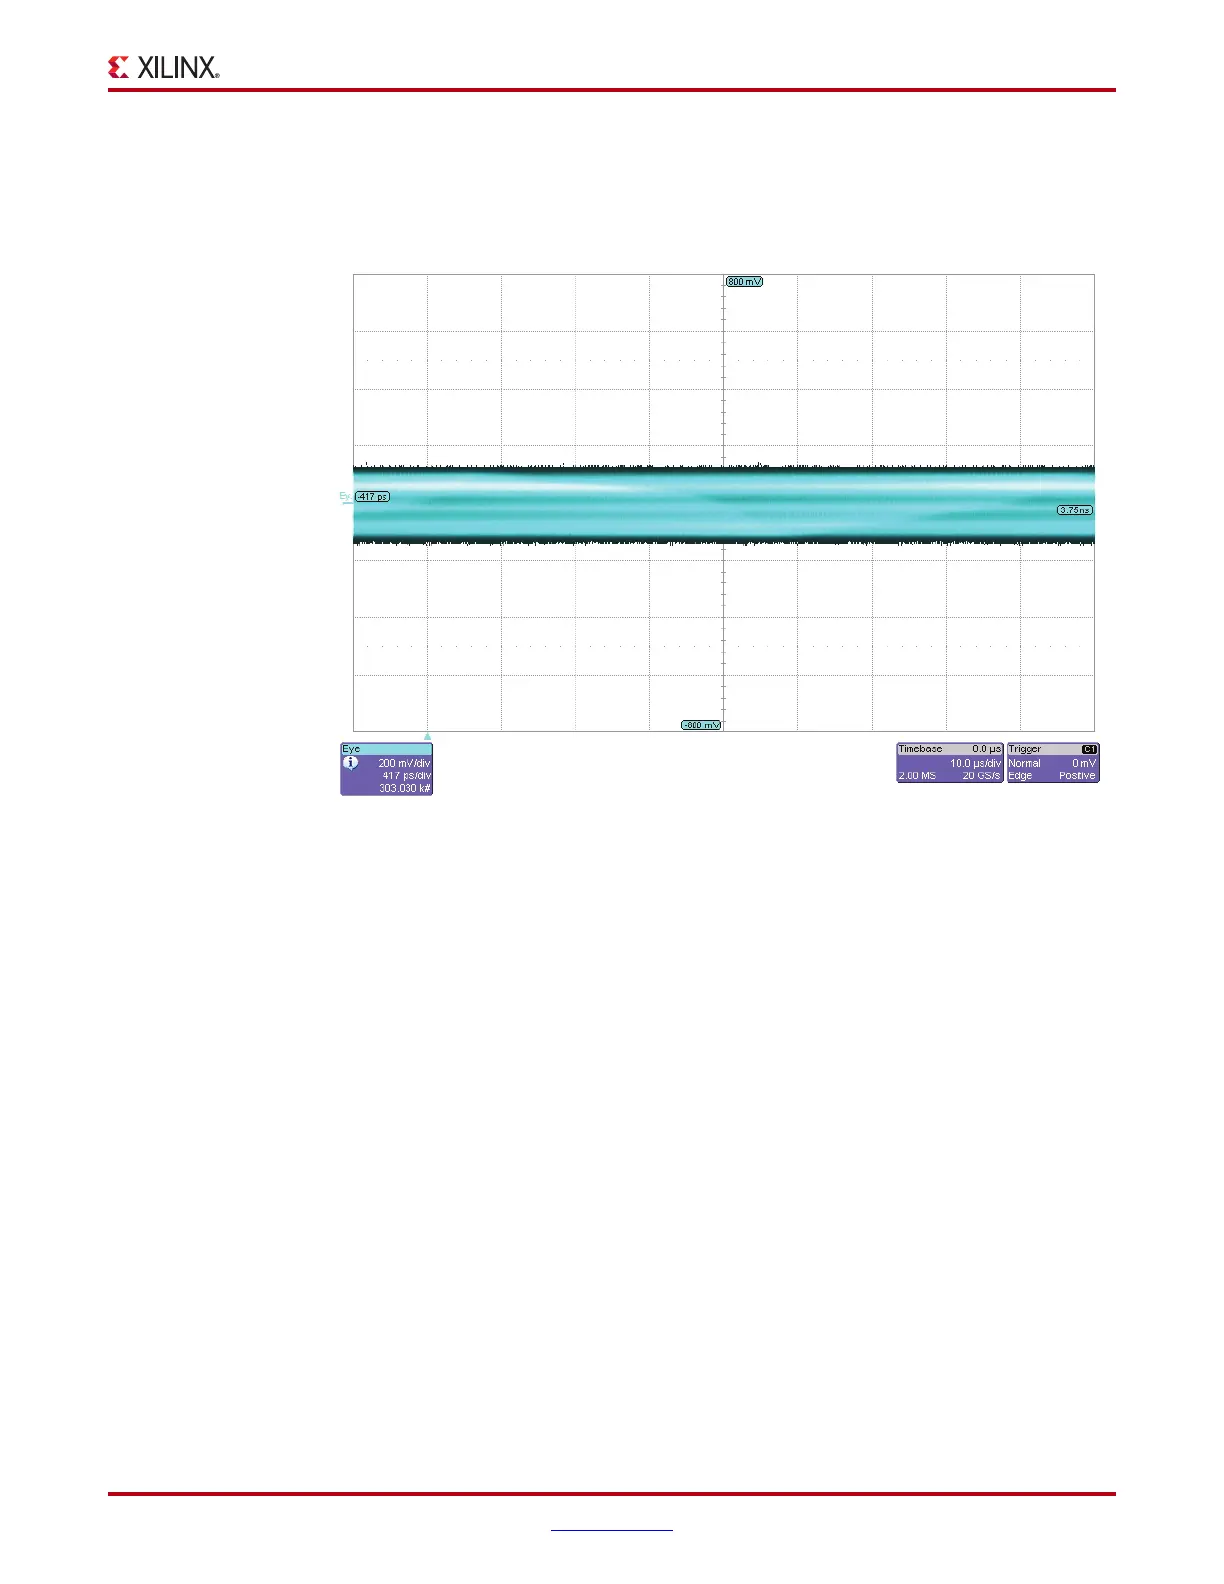
Figure 2-10 shows an infinite persistence noise measurement of the same design with a
wider variety of I/O activity. Because the infinite persistence measurement catches all
noise events over a long period, both correlated and non-correlated with the primary
aggressor, all power system excursions are shown.
The measurement shown in Figure 2-9 and Figure 2-10 represents the peak-to-peak noise.
If the peak-to-peak noise is outside the specified acceptable voltage range (data sheet
value, V
CC
± 5%), the decoupling network is inadequate or a problem exists in the PCB
layout.
Noise Spectrum Measurements
Having the necessary information to improve the decoupling network requires additional
measurements. To determine the frequencies where the noise resides, noise power
spectrum measurement is necessary. A spectrum analyzer or a high-bandwidth
oscilloscope coupled with FFT math functionality can accomplish this.
The FFT math function can be built into the oscilloscope, however, many of these functions
do not have resolution sufficient to give a clear picture of the noise spectrum. Alternatively,
a long sequence of time-domain data can be captured from an oscilloscope and converted
to frequency domain using MATLAB or other post-processing software supporting FFT.
This method has the advantage of showing as much resolution as the user is willing to
process. If neither math capacity is available, the noise frequency content can be
approximated by visually examining the time-domain waveform and estimating the
individual periodicities present in the noise.
A spectrum analyzer is a frequency-domain instrument, showing the frequency content of
a voltage signal at its inputs. Using a spectrum analyzer, the user sees the exact frequencies
where the PDS is inadequate.
X-Ref Target - Figure 2-10
Figure 2-10: Infinite Persistence Measurement of Same Supply
 Loading...