54 / 99 www.xovis.com
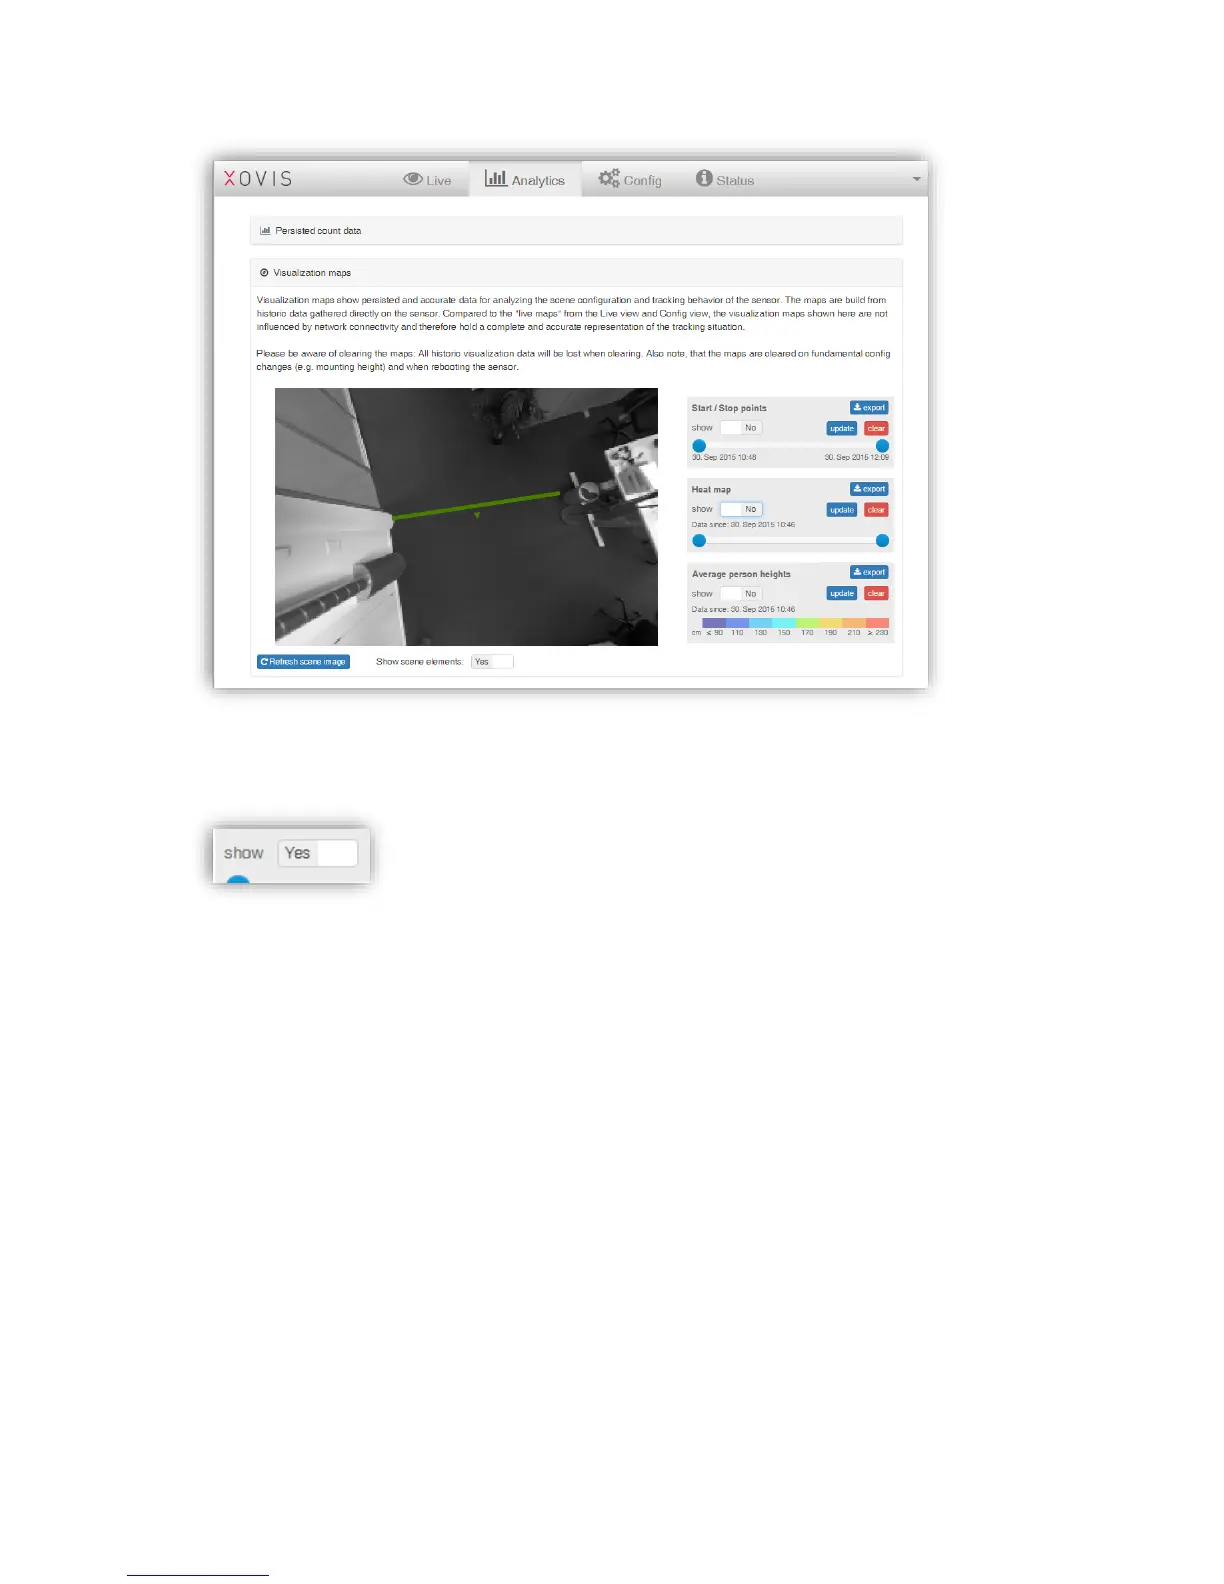
Each single map type can be overlaid on the scene by just toggling the dedicated “show”-
toggle.
In the next example the Start / Stop points are shown on the scene. The slide bar allows to
navigate through the monitored time period and to visualize the start / stop points depending
on it. Based on this it is now possible to see how the start / stop points have been generated
over the time. The sensor holds the past 10’000 points and will replace the oldest point with a
new one when the limit is reached.