55 / 99 www.xovis.com
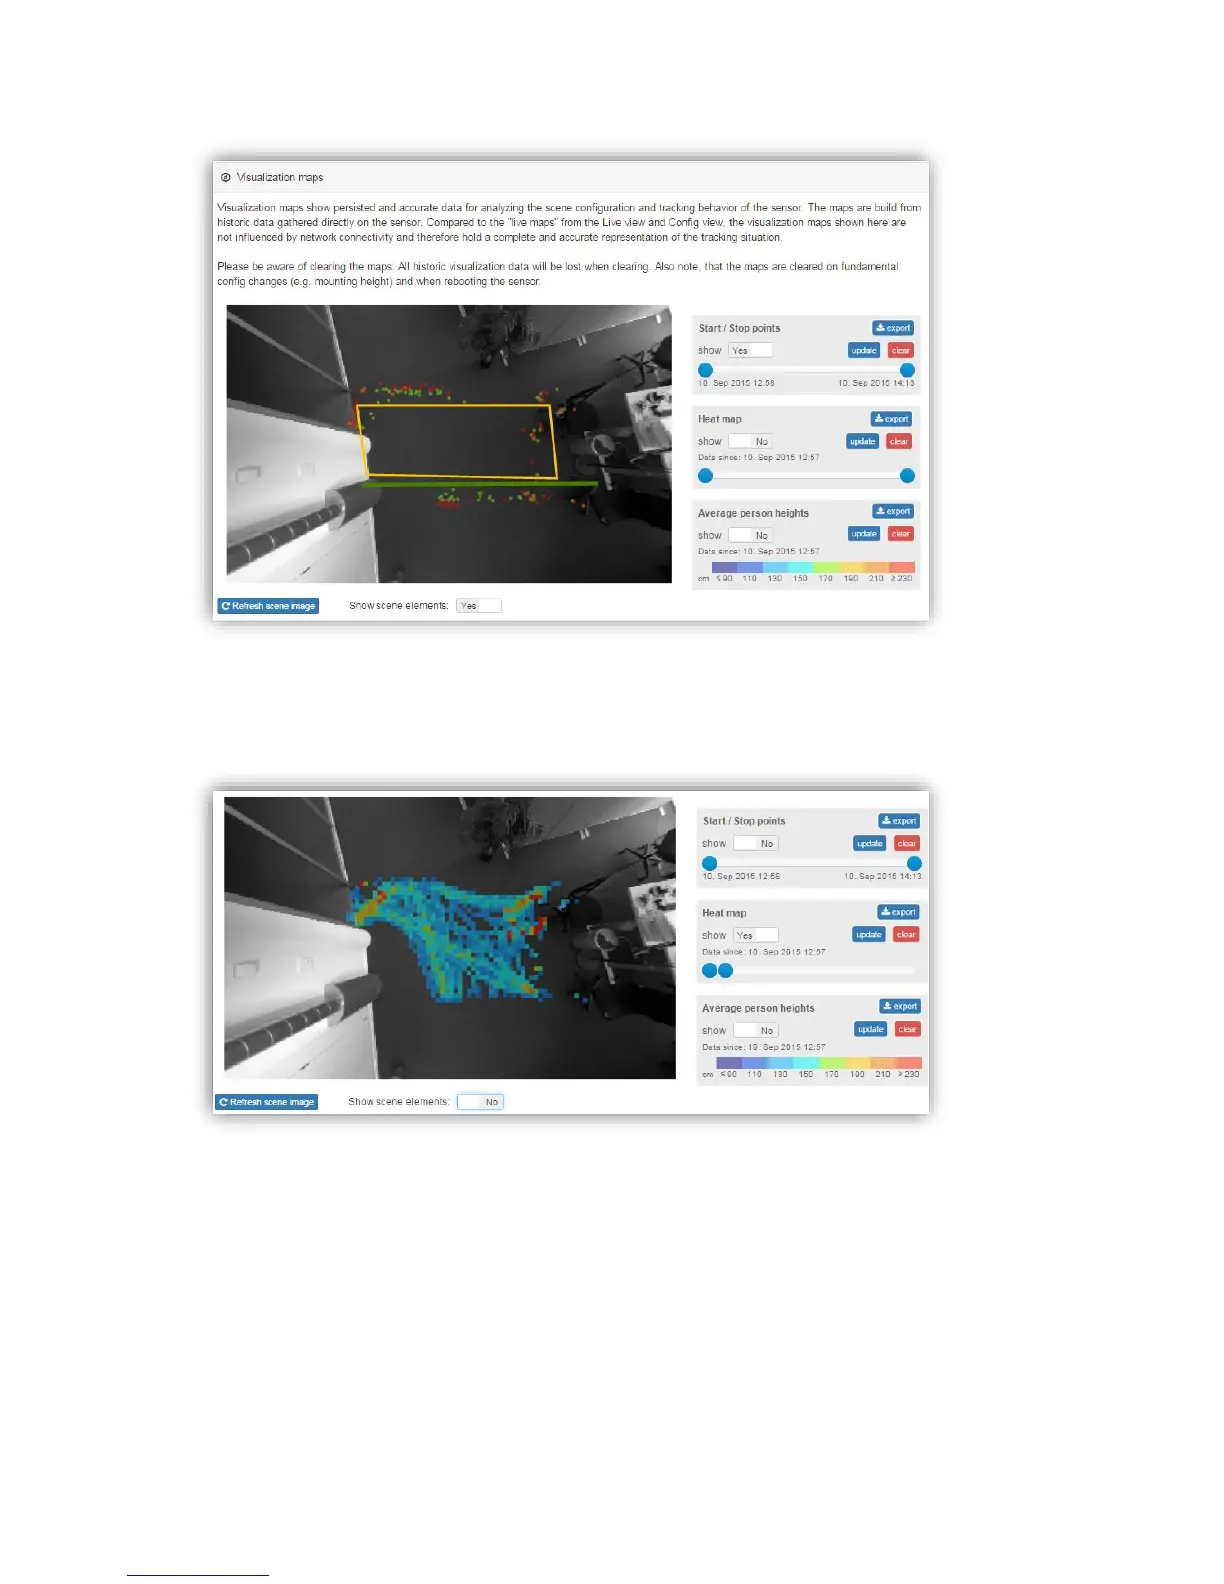
The heat map shows a dwell-time based coloring of the scene traffic. With the slide bar it is
possible to adjust the saturation. Using it allows to also highlight paths with less traffic.
The Height map displays the average person heights within the scene. This averaged map
can help to if a sensor was moved after configuration. The averaged map will then show a
clear slope. It also helps to validate a proper calibration of the sensor (heights differ too
much from excepted value). The colors are explained in the legend on the side.