Agilent Technologies Helium Leak Detector
106
DRAFT 12
/11/17
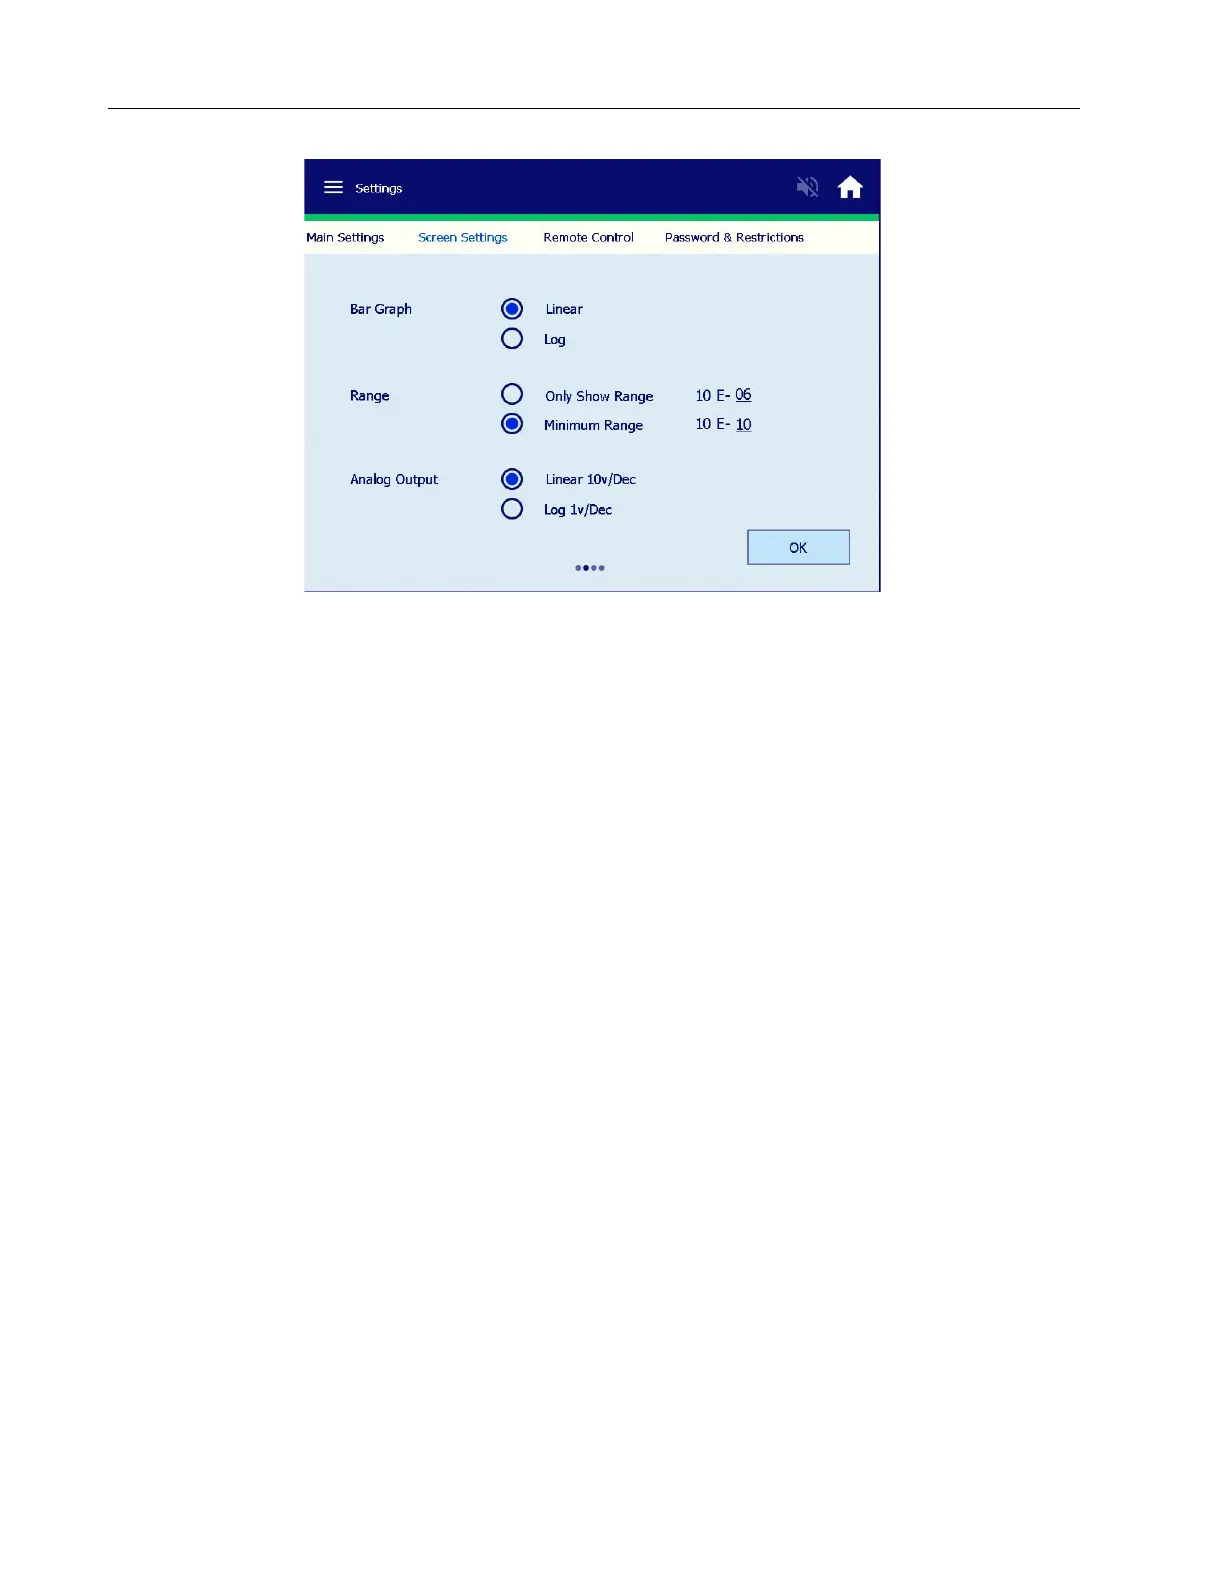
Figure 6-3 Settings: Screen Settings
Buttons and Fields
Bar Graph Configures the bar graph:
❑ Linear Scale - The linear bar graph leak rate appears across
the top of all screens when selected. In the Linear Bar Graph
display mode, the bar graph display represents the mantissa
of the leak rate, spanning from 0 to 10. The numerical
display (located to the upper right of the bar graph) indicates
the leak rate exponent value. This mode offers exceptional
resolution within a decade.
❑ Log Scale - The log bar graph leak rate appears across the
top of all screens. In Log Bar Graph display mode, the bar
graph display represents the entire leak rate range of the leak
detector, spanning from E-11 atm cc/sec to E-4 atm cc/sec.
The numerical display (located to the upper right of the bar
graph) is not lit in this mode.