VS Series Helium Mass Spectrometer Leak Detectors
DRAFT 4/23/15
2-15
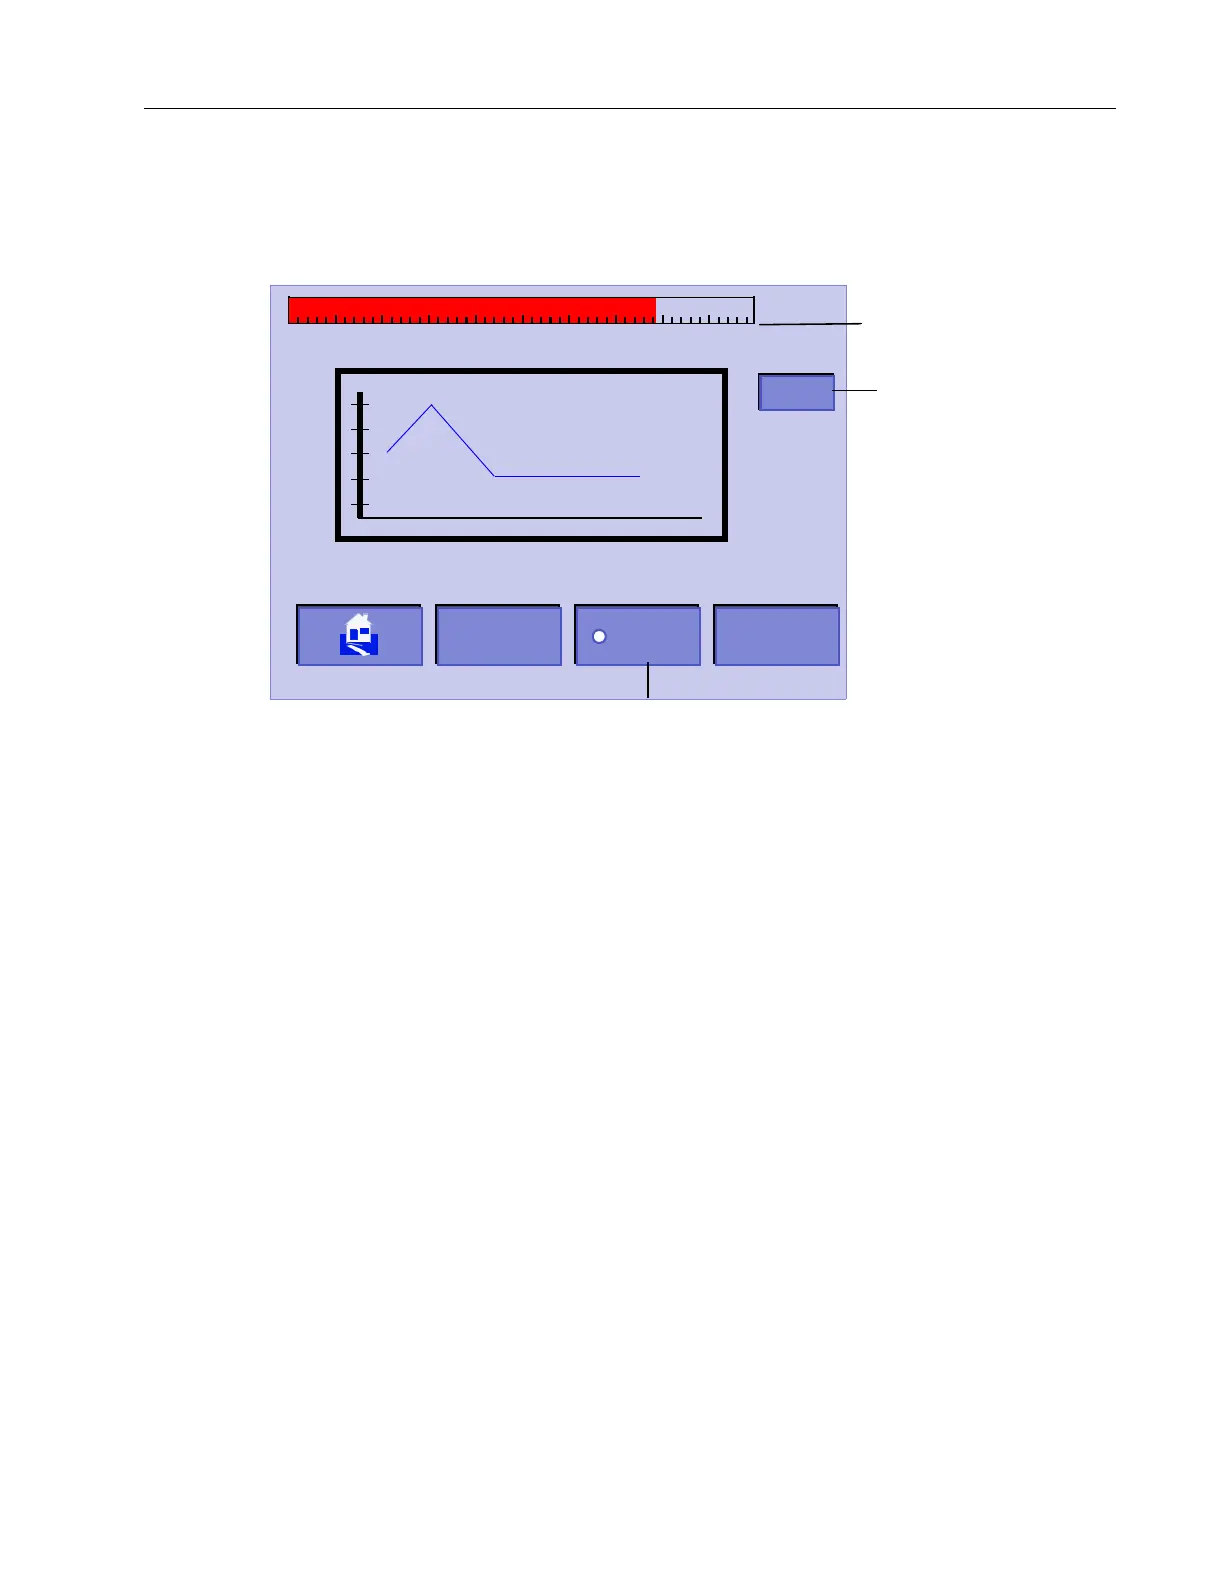
2.2.3.1 Graphical Display Screen
The graphical display screen (Figure 2-6) represents the leak rate over time. The graphing
line appears in blue and changes to red when a reject set point is triggered.
Figure 2-6 Graphical Display
Timer Toggles the g r a p h i ng time between 120 and 720 seconds. The
timer automatically defaults to 120 seconds on leak detector start
up. Press the toggle button while graphing to clear the current
graph. The data rate for the timers are:
120 seconds - two measurements/second
720 seconds - one measurement/three seconds.
Clear Clears the plotted graph. The graph automatically clears when the
leak detector is in roughing mode or at the start of a new test.
Zero Zeroes out the displayed helium leak. The leak rate must be less
than 4.0E-7, while in Test, to allow a cross over to Fine Test.
This button causes the leak detector to reset the leak rate display,
while the graph tracks the effect of the Zero command.
012345678910
-
10
DONE
Linear Leak Rate Display
and Range Exponent
CLEAR DONEZERO
Zeroes out the helium signal
120
atm-cc/sec
sec
-03
-05
-07
-09
-11
1
720
Toggles the timing scale
 Loading...