VS Series Helium Mass Spectrometer Leak Detectors
DRAFT 4/23/15
3-13
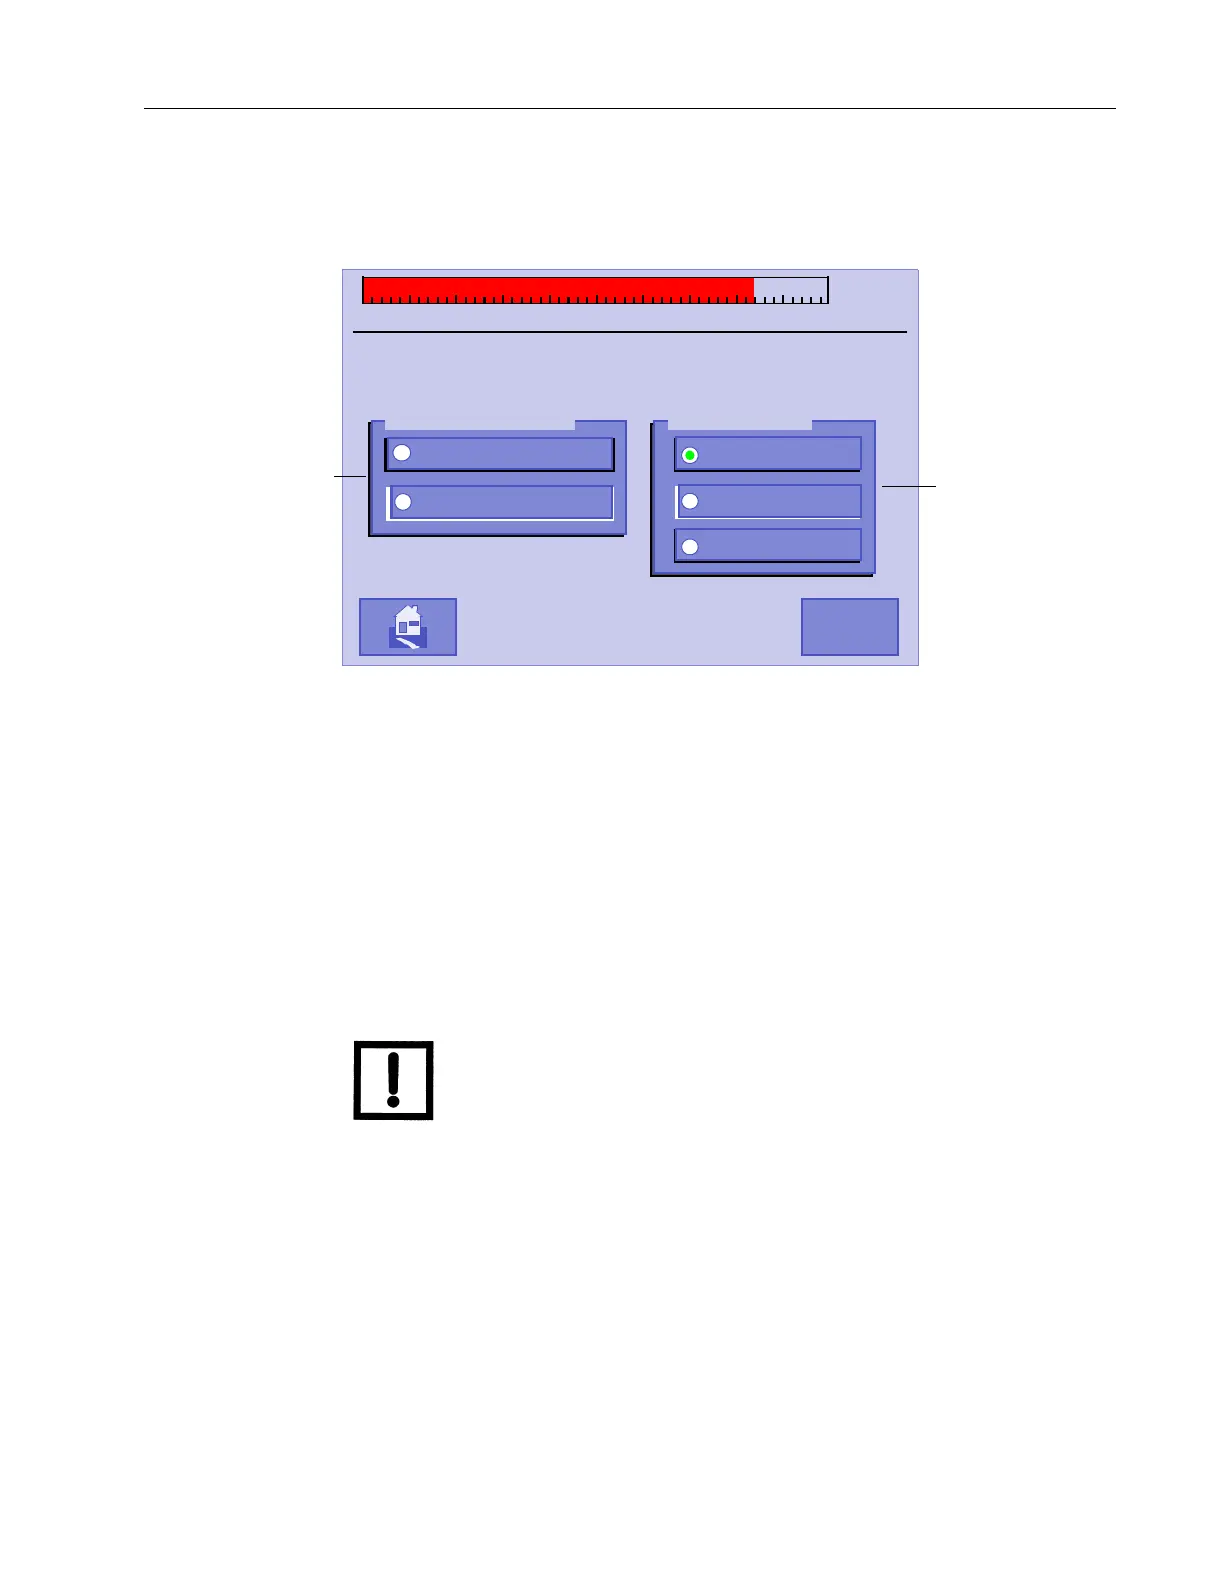
3.1.4 Output Control
❑ Press Output Control and the Output Control screen appears (Figure 3-8).
Use this screen to select the desired leak rate output, and Bar Graph display mode.
Figure 3-8 Output Control
Analog Output Configures the analog outputs:
❑ Linear 10 V/DEC
Linear output running from 0 to 10 V for each decade.
Figure 3-9 shows the linear output voltage as a function
of leak rate.
❑ Log 1 V/DEC
Log output at 1 V per decade. Figure 3-10 shows the log
output voltage as a function of pressure.
NOTE For added accuracy add .06 to V
out
.
Leak Rate = 10
Vout+ .06
/10
11
.
Bar Graph Configures the bar graph:
❑ Linear Only
The linear bar graph leak rate appears across the top of
all
screens when selected. In the Linear Bar Graph display
mode, the bar graph display represents the mantissa of the
leak rate, spanning from 0 to
10. The numerical display
(located to the upper right of
the bar graph) indicates the
leak rate exponent value. This
mode offers exceptional
resolution within a decade.
0 1 2 3 4 5 6 7 8 9 10
-
10
OUTPUT CONTROL
DONE
BAR GRAPH
LINEAR
LOG
LOG+LINEAR
ANALOG OUTPUT
LINEAR 10V/DEC
LOG 1V/DEC
Press to select the
Analog Output type.
Press to select the
bar graph units.
 Loading...