VS Series Helium Mass Spectrometer Leak Detectors
3-14
DRAFT 4/
23/15
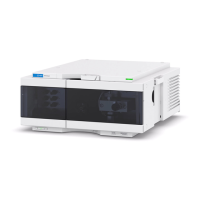
Figure 3-9 Leak Detector Linear Output Voltage
❑ Log Only
The log bar graph leak rate appears across the top of all
screens. In Log Bar Graph display mode, the bar graph
display represents the entire leak rate range of the leak
detector, spanning from 10
11
atm cc/sec to 10
4
atm
cc/sec. The numerical display (located to the upper right of
the bar graph) is not lit in this mode.
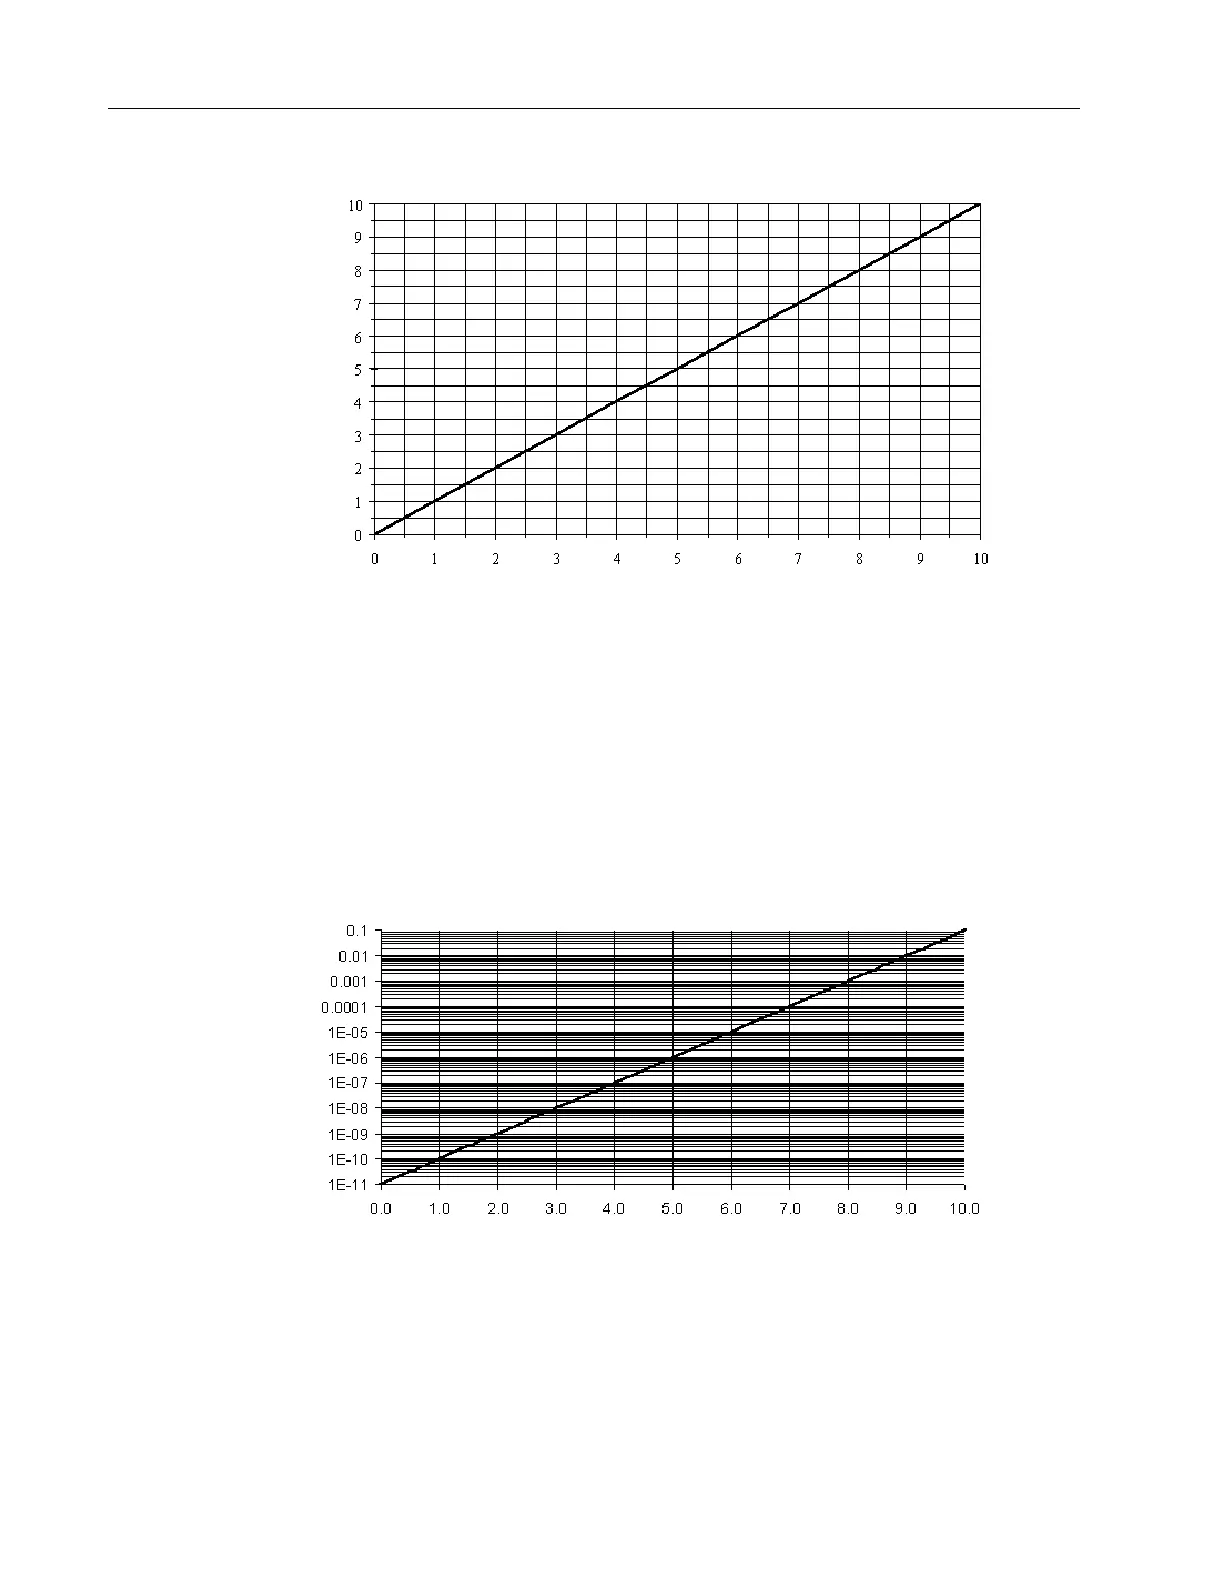
Figure 3-10 Leak Detector Logarithmic Output Voltage
Log + Linear – both log and linear bar graphs appear across the top of the Home screen
while all other screens only display the linear bar graphs across the top.
Output Voltage = Leak Rate Mantissa
Output Voltage (Volts)*Standard and High Sensitivity Versions
Leak Rate (Std. cc/Sec)
Leak Rate Mantissa = Output Voltage
V = LOG (Leak Rate X 10
11
)
Output Voltage
Leak Rate atm-cc/Sec
Leak Rate = 10
V
/10
11
 Loading...