SH-300
Text Panel
Page 34 of 103
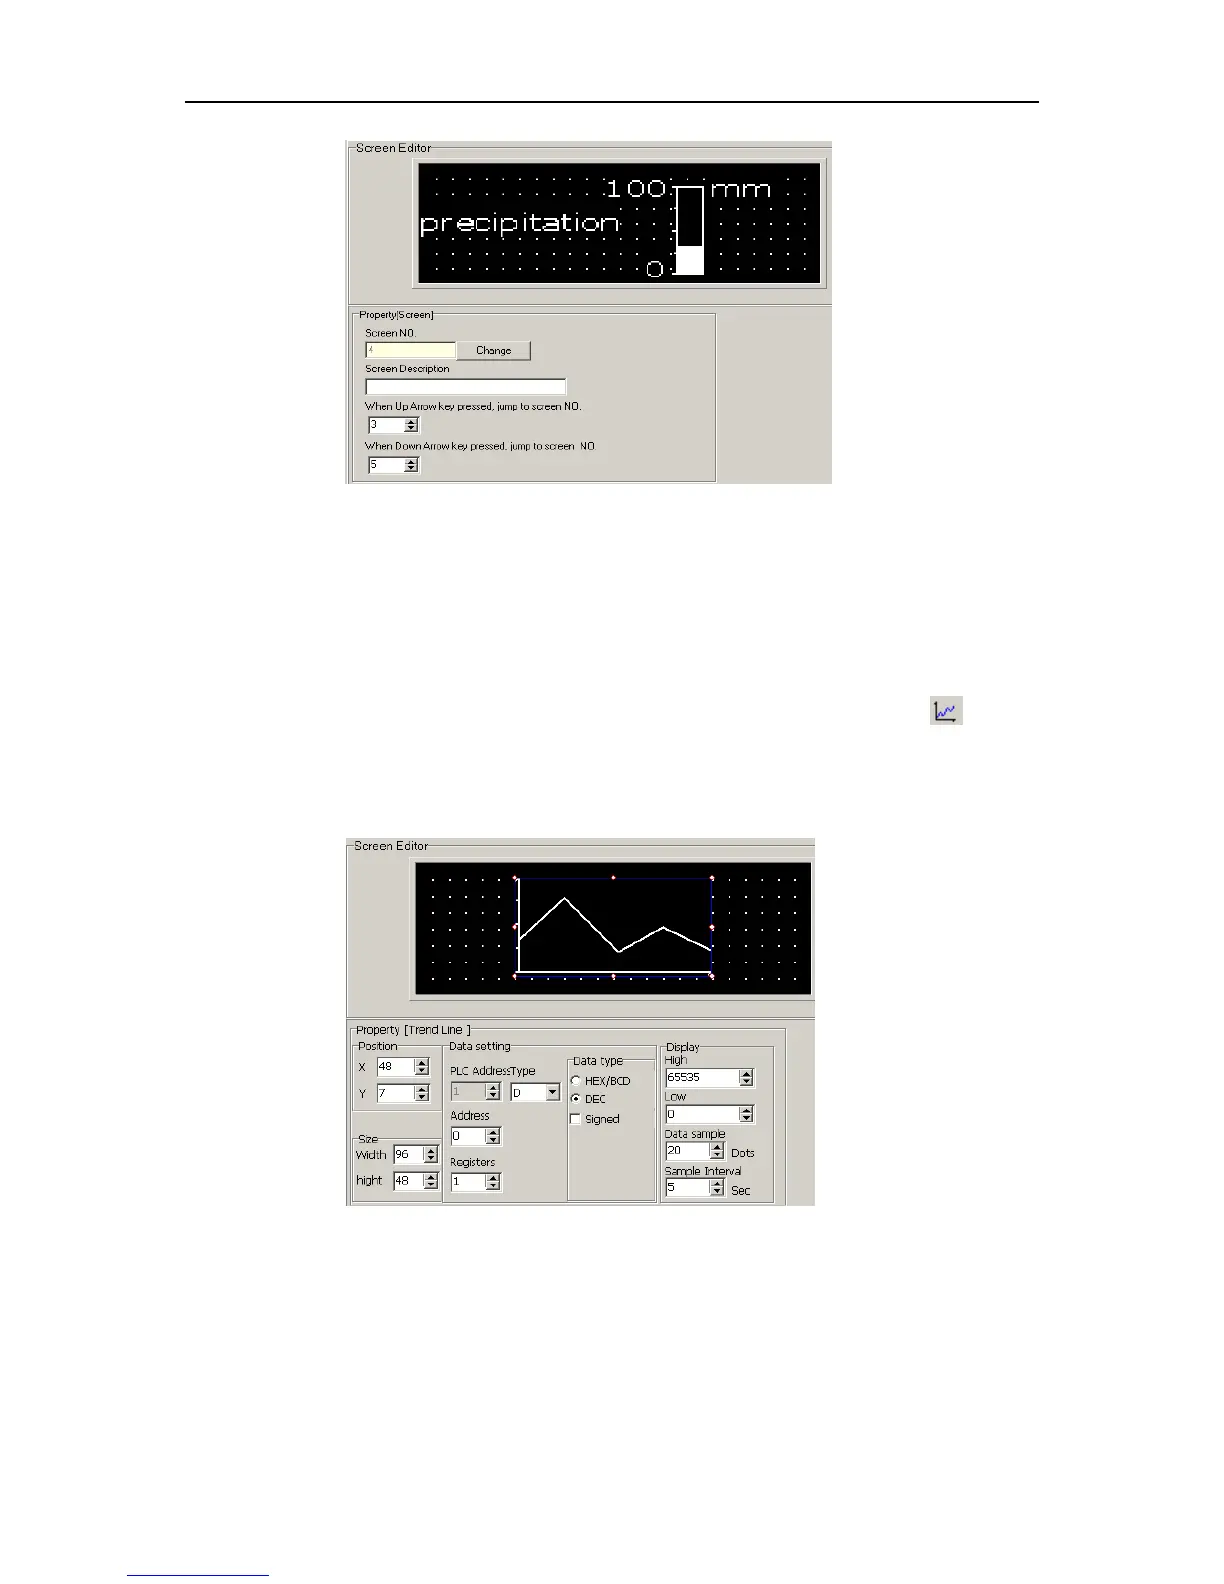
This bar graph can be used to monitor the data in register D0. If the bar graph is fully displayed,
it means the value in register D0 is 100. And when the bar graph is 20% displayed, it means the
value in register D0 is 20.
2.5.7 Trend Graph
Click “Trend Graph” option once with left button of mouse of menu “Object”, or click once in
toolbar, there will be a dashed rectangular frame following and moving together with the mouse.
Move the mouse to the proper position in the edit section and then click once the left button of the
mouse to confirm, and there will be one indicator in the edit section.
▲ Position Property:
X Position: specifying the horizontal position of the component
Y Position: specifying the vertical position of the component
Note: The grid origin is at the top left corner of the screen.
▲ Register
Set the address, number, type and mode (HEX/BCD, Decimal system and symbol) of the
related register.