SH-300
User’s Manual Software Part
Page 35 of 103
▲ Size
Set the height and width of the trend graph.
▲ Display
Full amount: 100% trend line will display the corresponding register value
Empty amount: 0% trend line will display the corresponding register value
Date dots: the total sample number in the whole trend line from left to right. The more the
number is, the trend line will be more fine and the time will be longer.
Sample interval: the interval between two neighboring sample dots.
Note: A trend line component can only display one line.
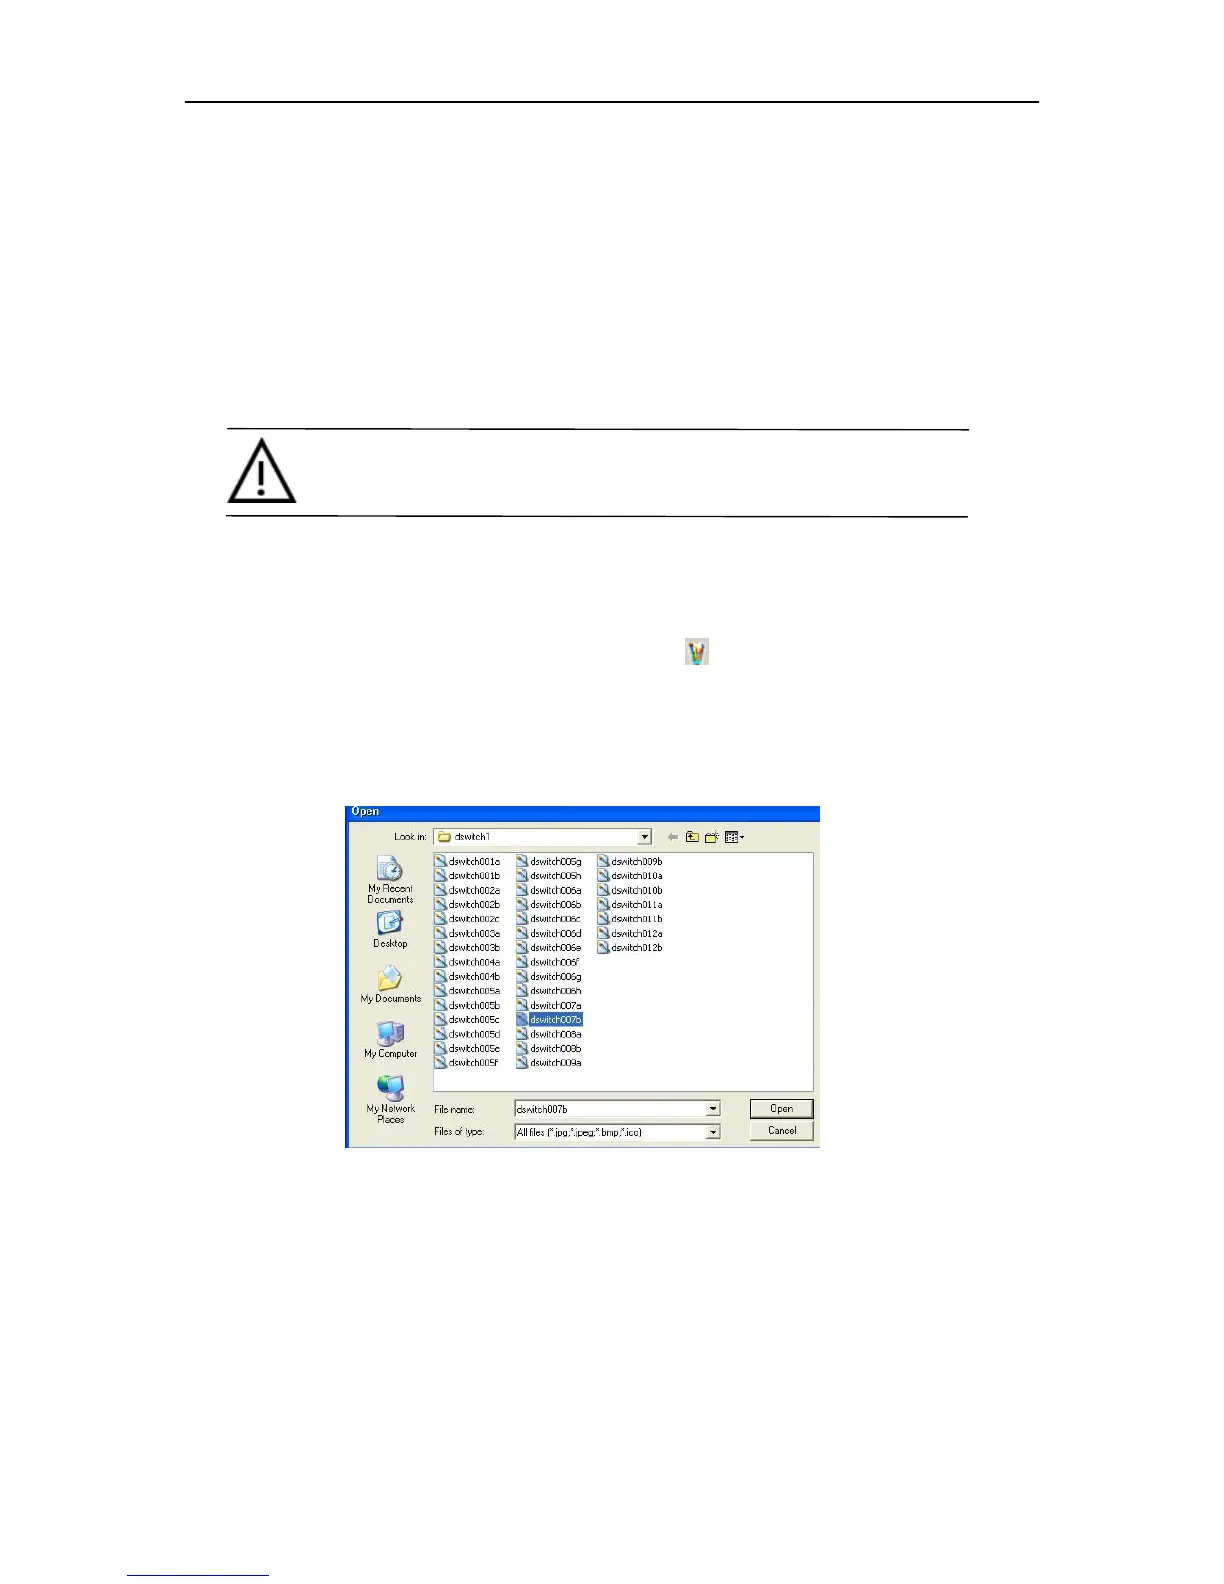
2.5.8 Bitmap
Select “Bitmap” option under “Component” or click icon in the tool bar, the following
prompting frame will be shown:
Select your desired picture and then click “Open” option. The selected picture will be put in the
edit window, as shown in the following diagram: