SH-300
User’s Manual Software Part
Page 33 of 103
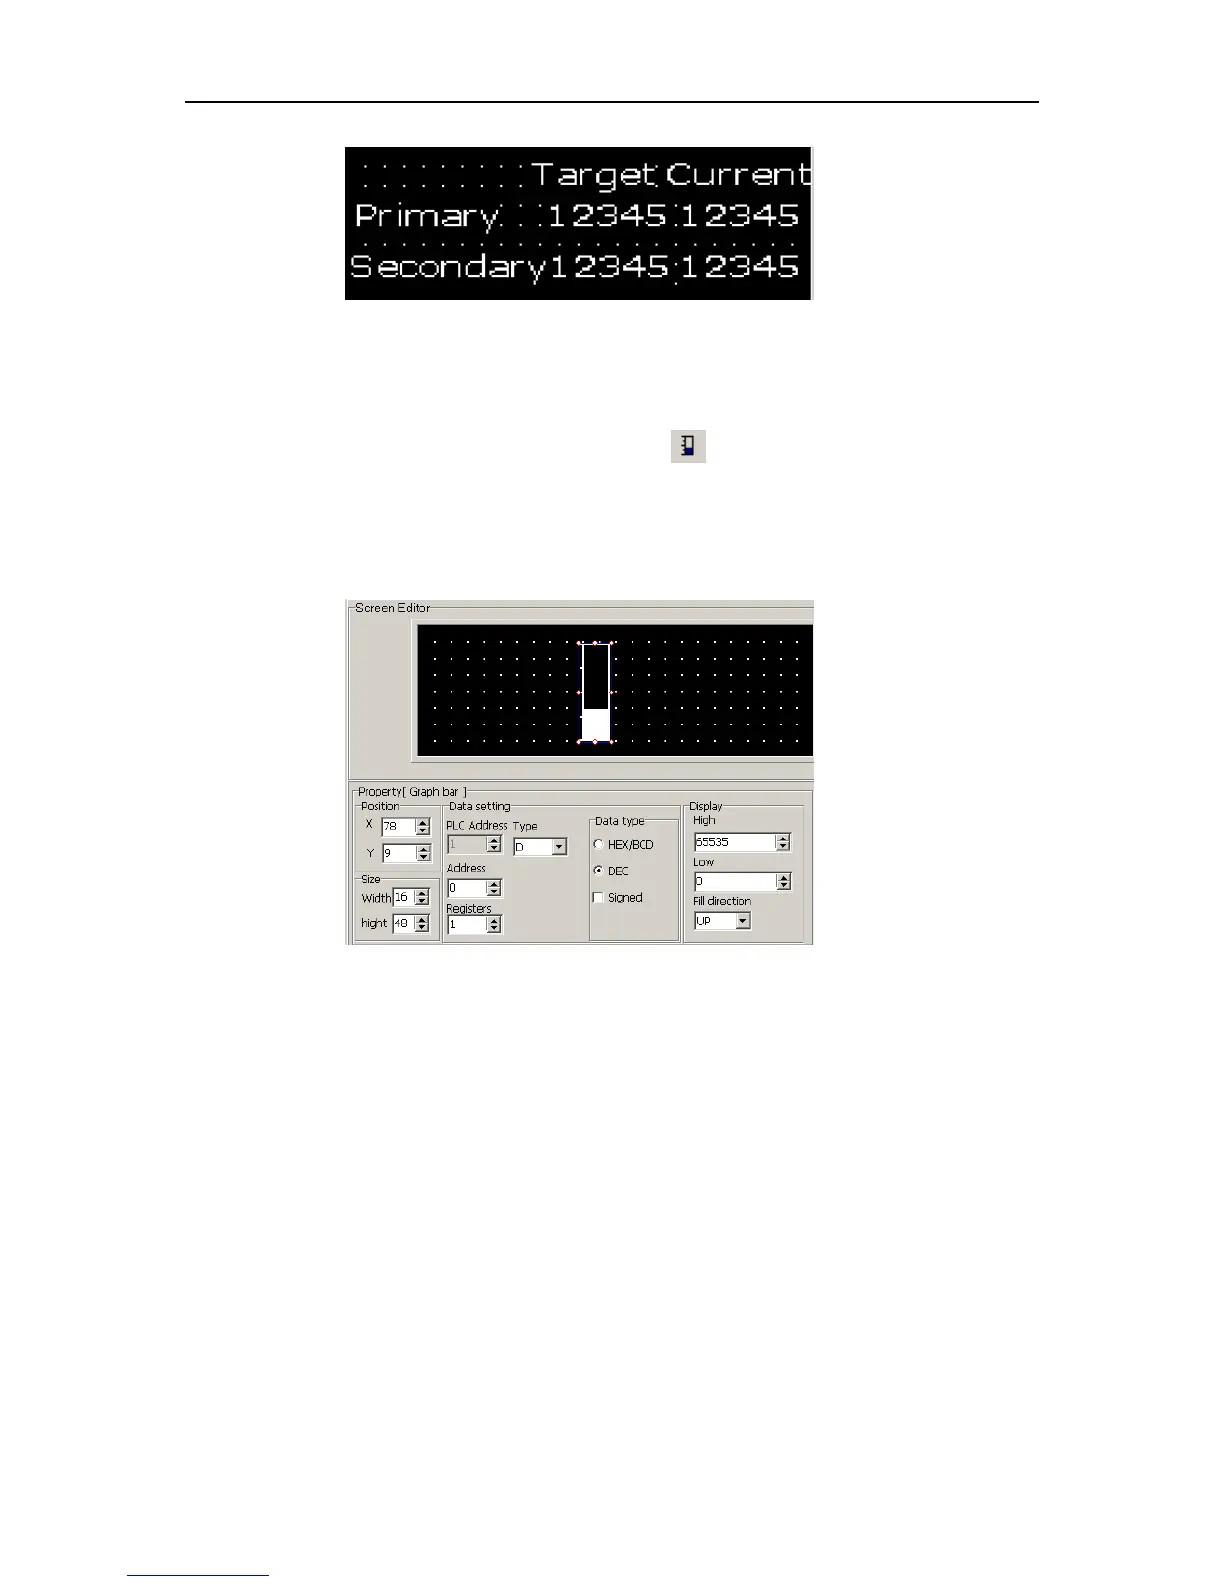
2.5.6 Bar Graph
Click “Bar Graph” option under Object” menu,click in toolbar, there will be a dashed
rectangular frame following and moving together with the mouse. Move the mouse to the proper
position in the edit section and then click the left button of the mouse to confirm, and there will be
one indicator in the edit section.
▲ Position Property:
X Position: specifying the horizontal position of the component
Y Position: specifying the vertical position of the component
Note: The grid origin is at top left corner of the screen.
▲ Register
Set the address, number, type and mode (HEX/BCD, Decimal system and symbol) of the
related register.
▲ Size
Set the height and width of the bar graph.
▲ Display
Full amount: 100% bar graph will display the corresponding register value
Empty amount: 0% bar graph will display the corresponding register value
Direction: the direction of the bar graph includes four options: up, down, left and right.
Example: Create a bar graph about precipitation and the display range is 0-100mm. Put the
texts “mm”, “precipitation”, “0”, “100” in proper position as shown in the following
diagram: