Ch. 19. Air Temperature Controller Sec. 19.7. Data Logging
Live graph Click on the ‘More’ button once to display the graph. Click on the ‘More’ button multiple
times to add sensors to the data plotted.
Data History Click on the ‘Save’ button to capture the history of the data.
• The data history is saved with the experiment. To review the data click on the pull down arrow
attached to the ’review suffix’ menu item. Select the particular data set you wish to review and hit
the ’more’ button to load the data into a graph.
Clear Erases the data in the graph and restarts the data acquisition. Be sure to use the ‘Save’ button first
or those data will be lost.
Note Remember to click on the ‘?’ button to the right of any menu item for a description of its function.
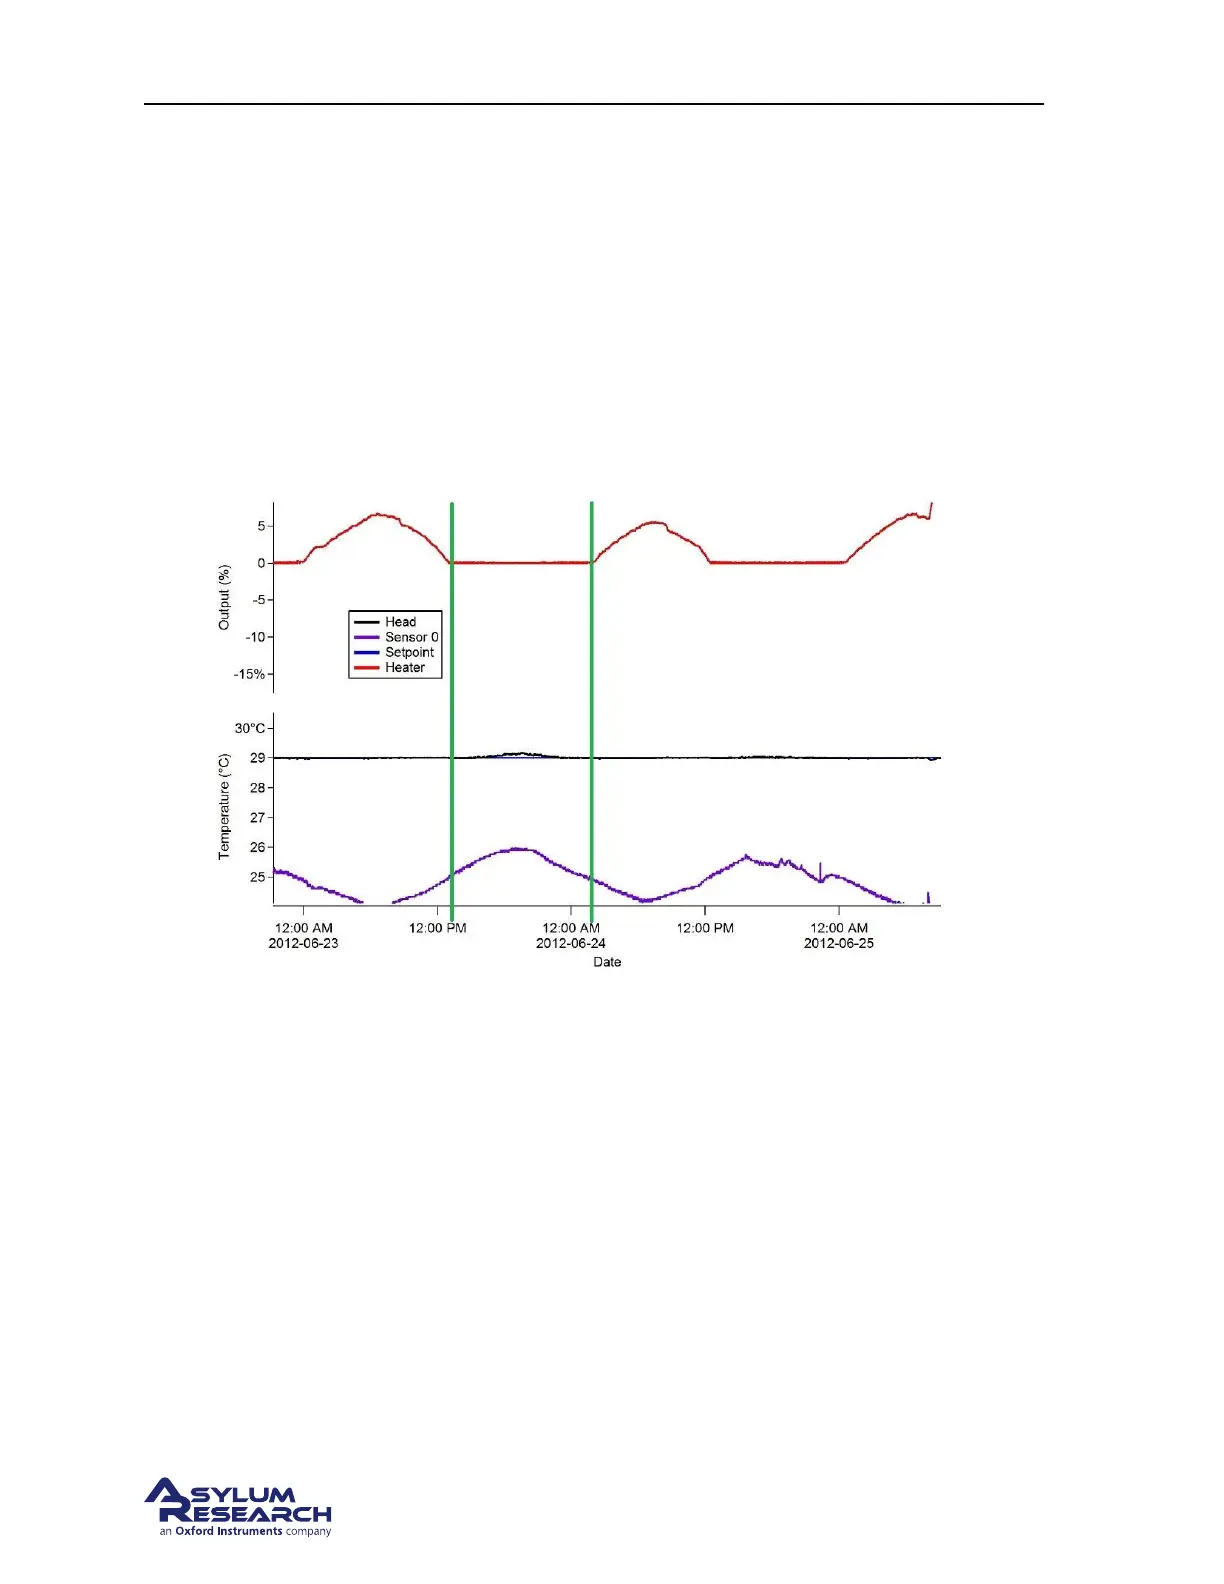
Figure 19.3.: Sample Data Log
Some example logged data are shown in
Figure 19.3 on page 218. These particular data log shows an
ATC unit under feedback set for 29 degrees C. The fan was set to 100%
Notice:
• The data between the green lines. The feedback loop has shut the heater power off. The Cypher
was already warmed up so all that needed to happen was for the fan to cool the head sensor
down. At this point the ambient temperature is rising high enough so that the fans can not cool
the enclosure temperature down to maintain 29 degrees. This is indicated by the head temperature
increasing above the Target Temperature
Note This is an example where the Target Temperature should be raised a degree to allow the ATC to
regulate the enclosure air temperature better. Ideally the target temperature is set so that the ATC never
applies 0% power. That means when your lab is at its maximum daily temperature swing, that the heater
is still able to control temperature.
BETA
Page 218