Ch. 6. Fluid Imaging in a Droplet Sec. 6.4. Imaging with the Droplet Holder
5.
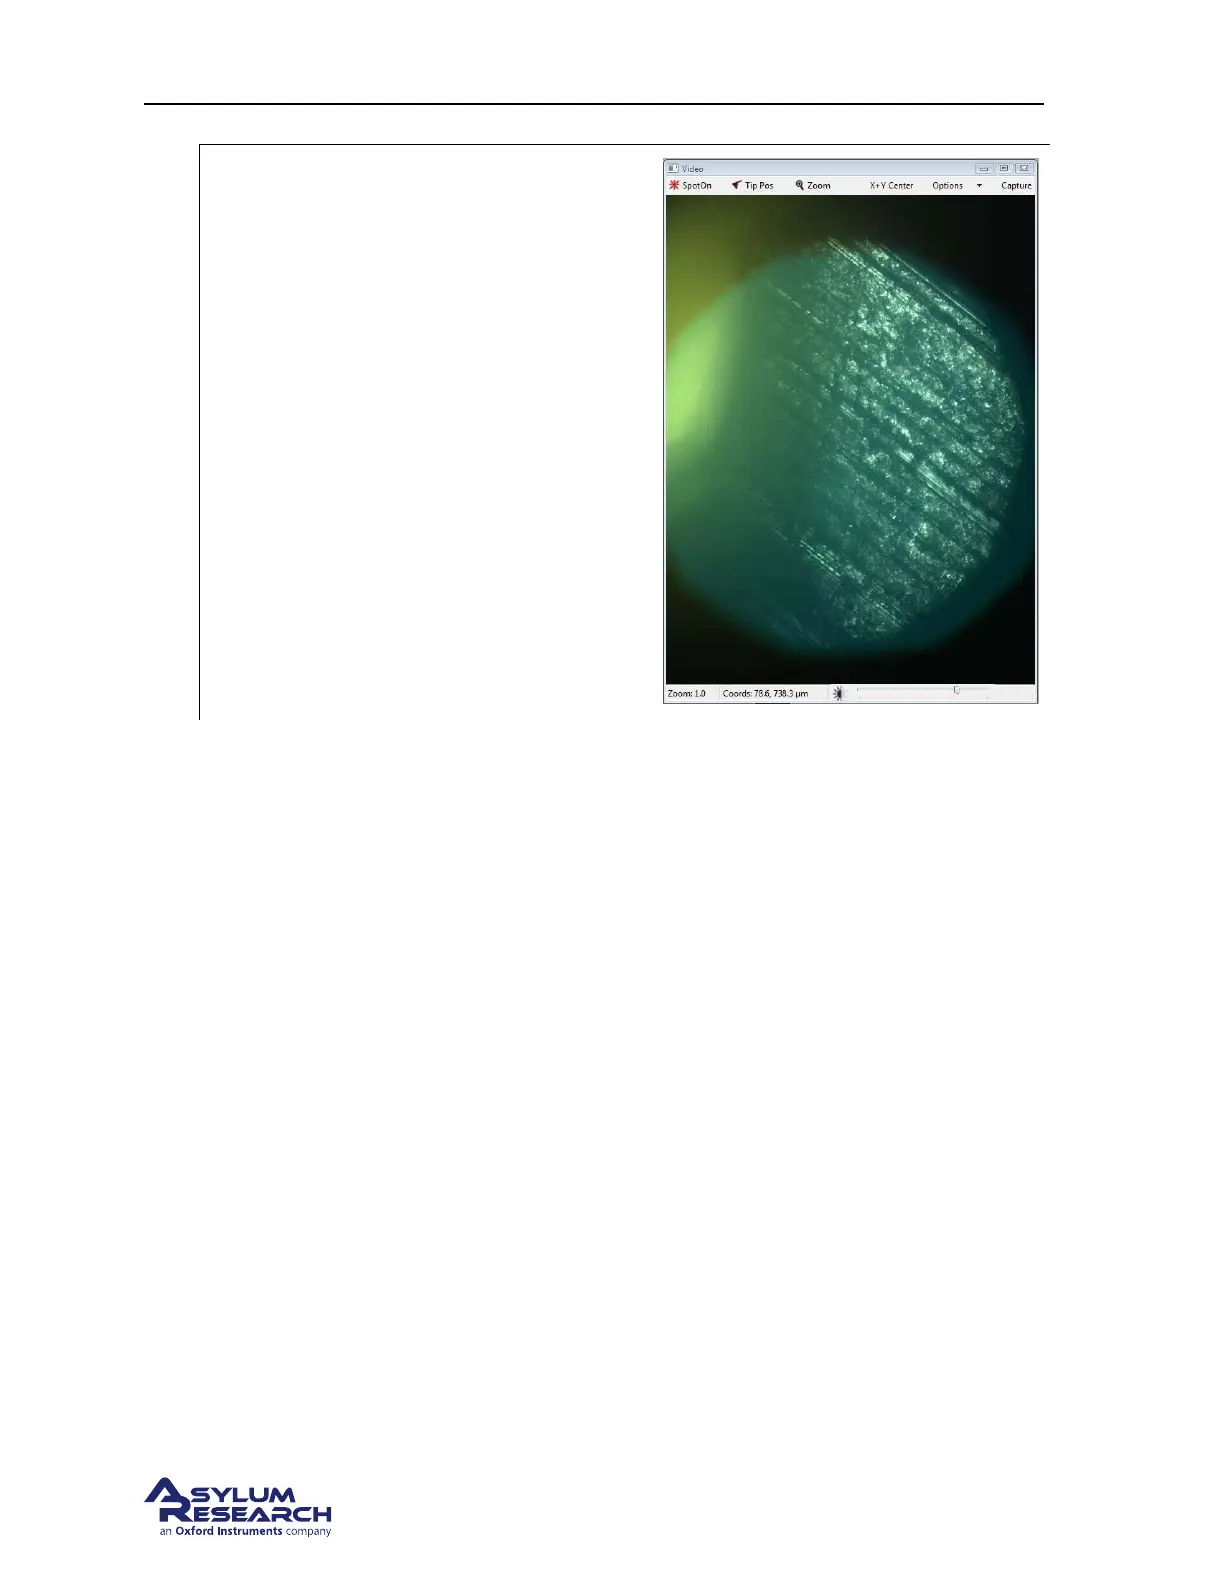
Going too far:
• If you cannot confirm you are focused
on the surface, slowly continue to lower
the objective until you see lots of coarse
looking features. These features are
typically scratches on the steel puck you
have mounted beneath the substrate. If
you see this type of structure, you have
focused below the sample surface and
need to raise the objective.
• Slowly raise the objective until you
either see:
– 1st - a feature on the sample surface
or
– 2nd - the edge of the field
diaphragm or
– 3rd - the cantilever.
6. If you have raised the objective focus all the way up to the level of the cantilever then lower the
objective back down to focus on the field diaphragm and set the sample focus there. You will be
approximately 30µm higher than the actual sample. The result of this is a slightly longer time for
the system to engage the tip.
7. Once the tip and sample (Field Diaphragm) focus have been set, click on the ‘Move to Pre-Engage’
button and make any small adjustments to the AFM spot position or deflection voltage prior to
engaging the tip.
6.4. Imaging with the Droplet Holder
6.4.1. AC Mode Tuning Specifics
The technique of AC mode imaging in fluid relies on the motion of the piezoelectric actuator in the
droplet holder to be sent to the cantilever through the fluid. This indirect or ”acoustic” drive of the
cantilever is greatly affected by the volume of fluid, the stiffness of the cantilever, and the frequency of
the drive signal.
In most cases it is not possible to simply auto tune the cantilever at it’s resonance. Manually tuning the
drive signal is the preferred method. In order to know where to tune you typically find the amplitude
peak by first measuring the thermal resonance of the lever. Once the thermal resonance is found, you
can overlay the thermal spectrum on the tune plot. As you drive the piezo in the droplet holder will see
several peaks in the amplitude plot as the drive frequency is swept. The peak you choose is typically the
highest peak inside or near the thermal peak.
BETA
Page 65