Quick Guide to the FFT Spectrum Analyzer
At the top of the An a lyzer panel is a drop-down list of the in stru ments
avail able in ATS. Up to this point, we have been us ing the au dio an a lyzer
to make mea sure ments. We will now take a look at the FFT spec trum an a -
lyzer. This in stru ment dis plays au dio sig nals in time (os cil lo scope-style)
and in fre quency (spec trum an a lyzer-style). It op er ates in a dif fer ent fash -
ion from the au dio analyzer, as explained next.
Real-Time vs. Batch-Mode Instruments
The au dio an a lyzer is a real-time in stru ment. That is, it re turns read ings
con tin u ously, whether or not a sweep is in prog ress. These read ings in -
clude level and fre quency, as well as func tions such as dis tor tion or phase.
Dur ing a sweep, read ings from the au dio an a lyzer are di verted from the
panel me ters to the sweep en gine for graph ing. Af ter the sweep, the read -
ings are once again dis played in the panel meters.
By con trast, the FFT spec trum an a lyzer is a batch-mode in stru ment. It
does not gen er ate read ings if a sweep is not be ing per formed. When a
sweep is started, the spec trum an a lyzer first ac quires a seg ment of au dio
by stor ing it in mem ory. This is in di cated on the Sta tus bar as ‘DSP Ac quir -
ing Data’. Once the ac qui si tion is com plete, the spec trum an a lyzer pro -
cesses the data. This is in di cated as ‘DSP Trans form ing Data’ on the Sta tus
bar. Once pro cess ing is com plete, ATS fetches a batch of read ings from the
spec trum an a lyzer. At that point, the data is graphed.
Chapter 5: Quick Guides Quick Guide to the FFT Spectrum Analyzer
40 Getting Started with ATS-2
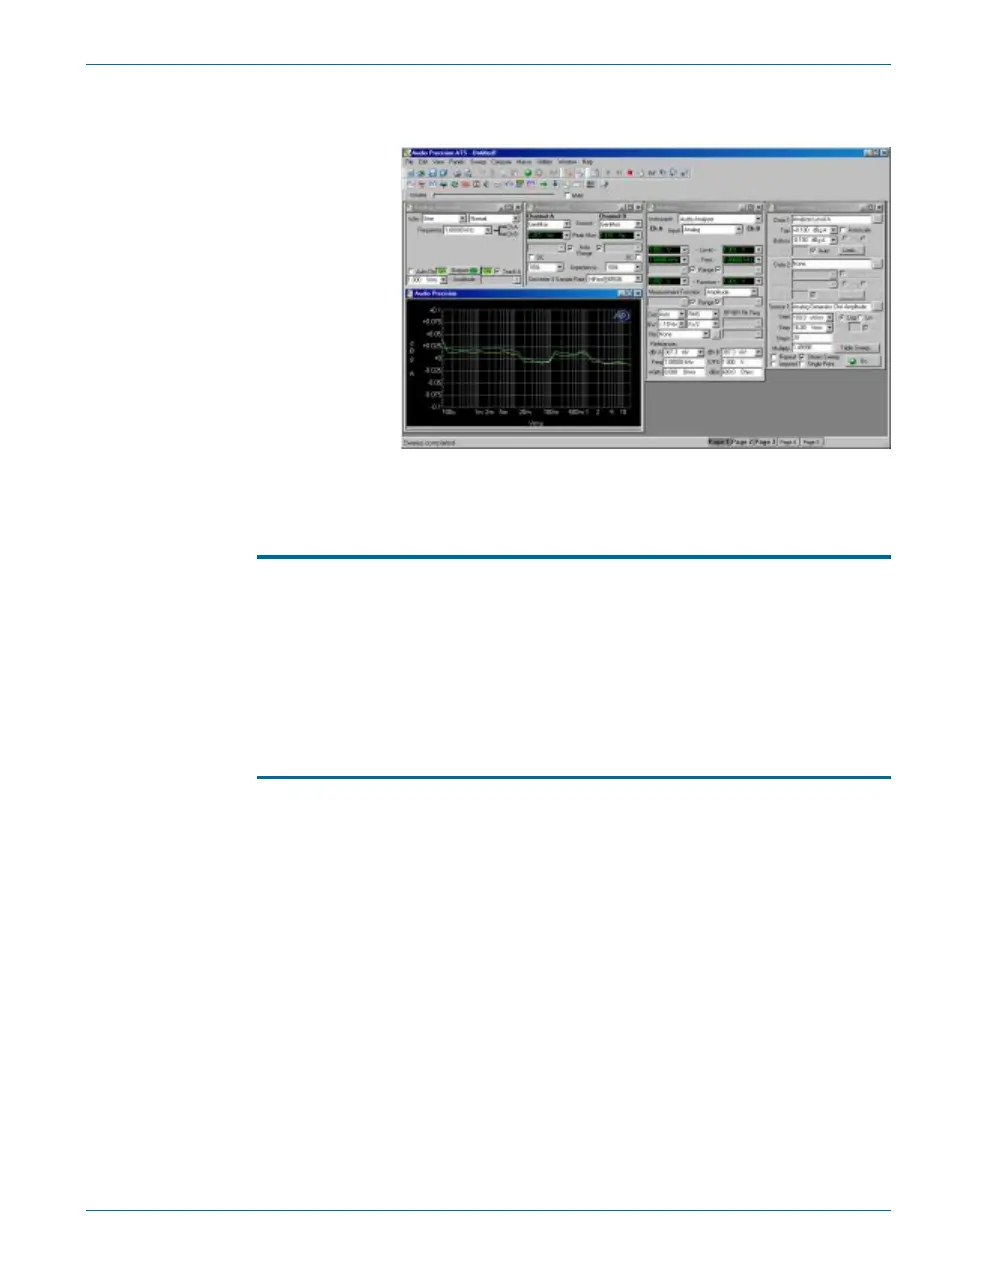
Figure 19. Current
workspace after
amplitude linearity
sweep, showing
typical results.