Panel Fields
There are two peak mon i tors near the top of the panel, one for each of
the ste reo chan nels. These me ters give an in di ca tion of the pres ence of sig -
nal at the FFT input.
Be low the peak me ters is an ar ray of fields for con fig ur ing the an a lyzer.
Here, we will use the de fault set tings. For more de tails on the set tings, see
Chap ter 11 of the ATS-2 User’s Man ual.
Time vs. Frequency
As men tioned, the FFT spec trum an a lyzer can dis play au dio sig nals in
the time do main and the fre quency do main. The choice of do main is de -
ter mined by the Source 1 field on the Sweep panel. If it is set to FFT.Time,
a time do main dis play re sults. If it is set to FFT.Fre quency, a fre quency do -
main display results.
The Sweep Spec trum/Wave form but ton in the stan dard toolbar al lows
FFT sweeps to be set up quickly. We will use this fea ture to ex am ine har -
monic dis tor tion in the ATS-2 system.
Quick Sweep Setup
First, per form a New Test, turn the an a log gen er a tor on, and set both
an a log in put chan nels to GenMon so that the gen er a tor sig nal is sent di -
rectly to the an a log in put. Choose FFT Spec trum An a lyzer from the In stru -
ment field at the top of the Analyzer panel.
Bring up the Sweep panel and click the Sweep Spec trum/Wave form
but ton on the Stan dard toolbar. The sweep is au to mat i cally set up for a
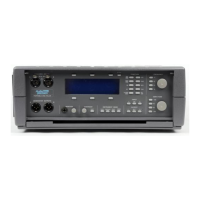
ste reo fre quency do main dis play from 20 Hz to 20 kHz. Click Go to per -
form the sweep. A graph sim i lar to Fig ure 20 is created.
Chapter 5: Quick Guides Quick Guide to the FFT Spectrum Analyzer
42 Getting Started with ATS-2
Figure 20. Typical default
FFT stereo frequency
domain graph.