The large peak in the mid dle of the spec trum is the 1 kHz, 1 V sine
wave fun da men tal pro duced by the an a log gen er a tor. There are smaller
peaks spaced at 1 kHz in ter vals above the fun da men tal. These are har -
monic dis tor tion com po nents gen er ated in the ATS-2 hard ware. These
har mon ics rise out of a wideband sys tem noise floor.
To look at the au dio sig nal in the time do main, click the Sweep Spec -
trum/Wave form but ton again. Source 1 changes to FFT.Time and the
graph up dates to show the new data. You should see a graph sim i lar to
Fig ure 20.
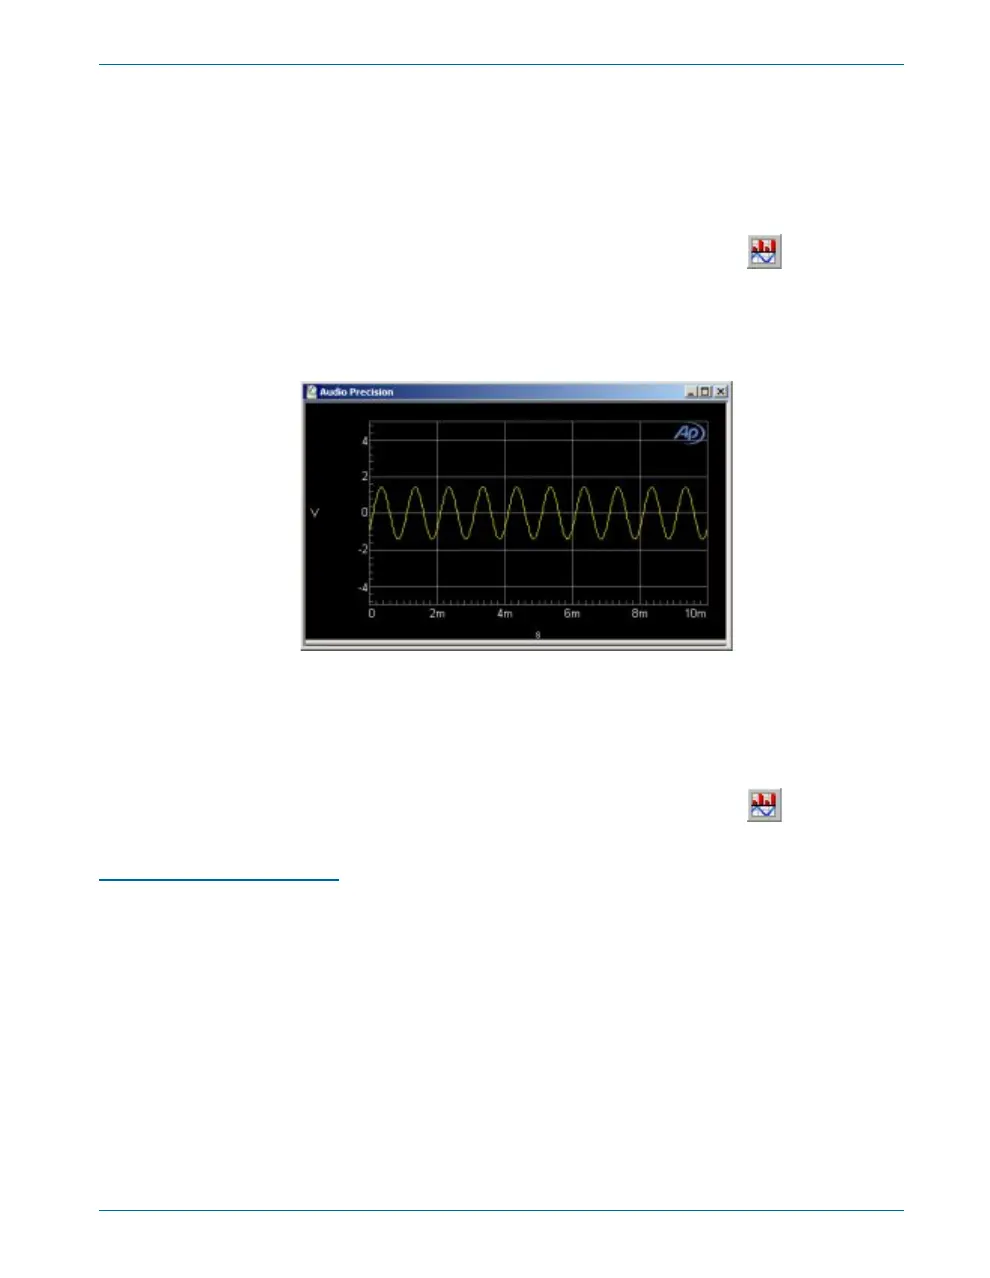
The dis play shows a sine wave with a pe riod of 1 ms (cor re spond ing to
a fre quency of 1 kHz) and a peak ex cur sion of 1.414 V (cor re spond ing to
an am pli tude of 1 Vrms). The ef fect of the dis tor tion on the wave form is
not vis i ble in the time domain.
You can switch be tween the time do main and fre quency do main dis -
plays at any time by click ing the Sweep Spec trum/Wave form but ton.
Fine-Tuning the Display
There are sev eral ways to ad just the graph dis play to more closely ex -
am ine fea tures of the ac quired wave form:
§
Zoom. On the graph, draw a box by holding down the left mouse
button and moving the mouse. When you release the button, ATS
zooms the selected area to the full graph size.
§
Zoomout. After zooming, click the right mouse button on the graph.
From this right-click menu, choose Zoomout. The graph zooms out to
the pre-zoom size.
§
Optimize. From the right-click menu, choose Optimize Left Only. The
vertical axis changes to best fit the data in the graph.
Quick Guide to the FFT Spectrum Analyzer Chapter 5: Quick Guides
Getting Started with ATS-2 43
Figure 21. Typical default
FFT stereo time domain
graph.