56926BA2, Rev. 02, 04/2019
Data Log
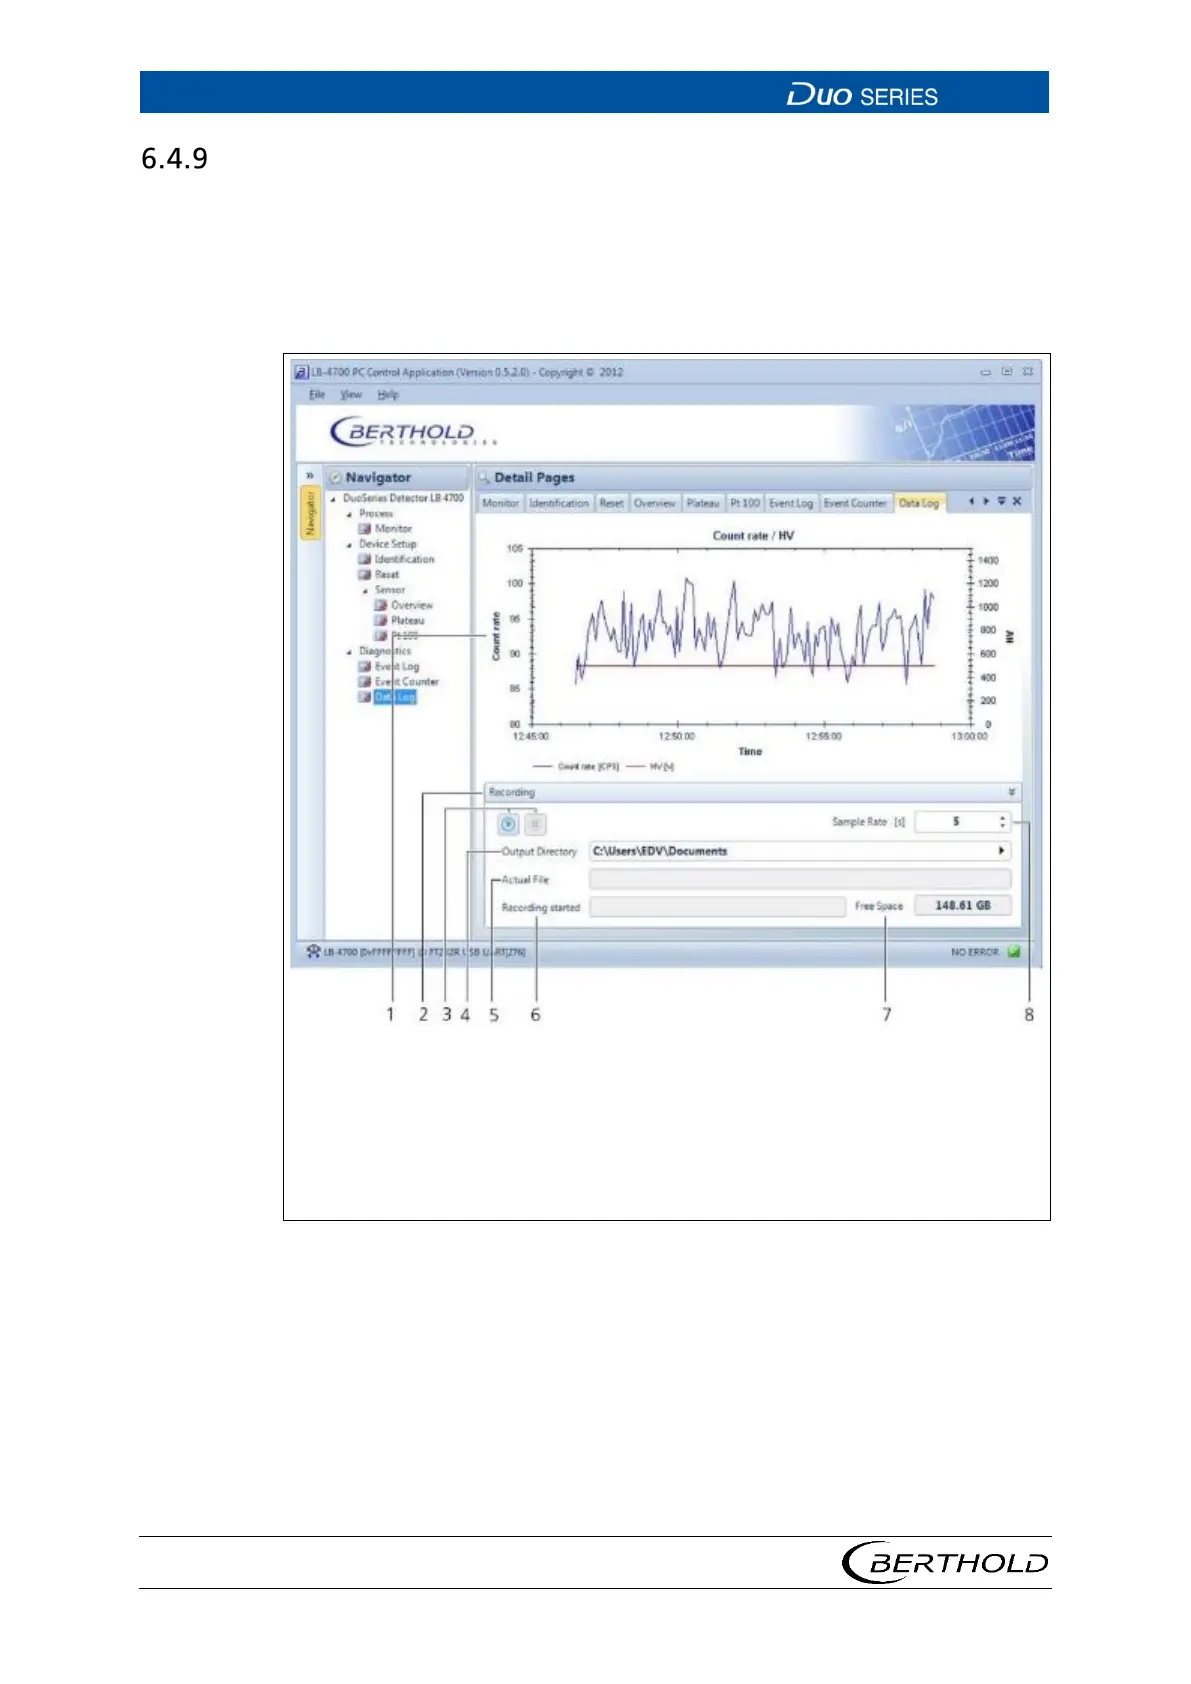
Open the submenu Data Log in the menu group Device Setup | Diagnostics of the
navigator by double-clicking on
<Data Log> (Fig. 36). The current count rate and
high voltage of the detector are shown graphically in this .
In addition, you can output the recorded chart values as a text file (.txt) and save
on the connected PC.
2
3
4
5
6
7
Graphical representation of the count rate and high voltage curve
Display and control panel "Recording"
Buttons to start recording and stop recording
Select output directory (output location of the log file)
Display actual file (name of the current log file)
Display recording started (date/time for the start of recording)
Display Free Space (free hard disk space on the connected PC)
Selection keys Sample Rate (log interval of the data logs)
36 Diagnostics | Data Log
1. To zoom, hold down the left mouse button in the chart box and highlight the
area to be zoomed.
2. Right-click in the chart box to open a window with the following settings:
o Copy: Copies the current chart view to the clipboard of PC
o Save Image as: Saves the current chart view on the PC
o Page Setup: Page settings for printing function.
o Print: Prints the current chart view.