Introductory Theory and Terminology
14 / 86 H171804E_14_001
Experienced users will always deal in ppm, and spectra reproduced in scientific journals will
have the horizontal scale graduated in ppm and not in Hertz.
The reader should be aware of some simplifications that have been made in the above
example. The value of the
1
H carrier frequency on a 500 MHz spectrometer will not be exactly
500 MHz. The carrier frequency to be used in a ppm calculation should be the precise value
assigned to the parameter SF01. Similarly for the 600 MHz and 400 MHz spectrometers,
quoted above the
1
H carrier frequency, will not be exactly 600 MHz and 400 MHz,
respectively.
Note also that a positive ppm value denotes a frequency higher than TMS and is defined as
downfield relative to TMS.
3.3 Proton NMR - Chemical Shift
Since
1
H is the most commonly observed isotope in NMR experiments, this shall now be
dealt with in greater detail. A
1
H nucleus contains a single proton and spectra in which
1
H is
the observe nucleus are normally referred to as proton spectra.
It was stated previously that a proton in an 11.7 T magnet will display a basic resonance
frequency of approximately 500 MHz, but that the precise resonance frequency will depend
upon the local atomic environment. A proton in a molecule of chloroform resonates at a
slightly different frequency compared to a proton in benzene (C
6
H
6
). Therefore, the emitted
frequency acts as a label which gives analysts qualitative information on the local atomic
neighborhood in which a proton is located. This is the basis of NMR.
The variation in precise resonance frequency is referred to as the chemical shift. The
resonance frequency is shifted by the effect of neighboring atoms and the extent of magnetic
shielding from local electrons discussed earlier. The size of the shift is normally measured in
ppm relative to the TMS peak which is referenced to 0 ppm.
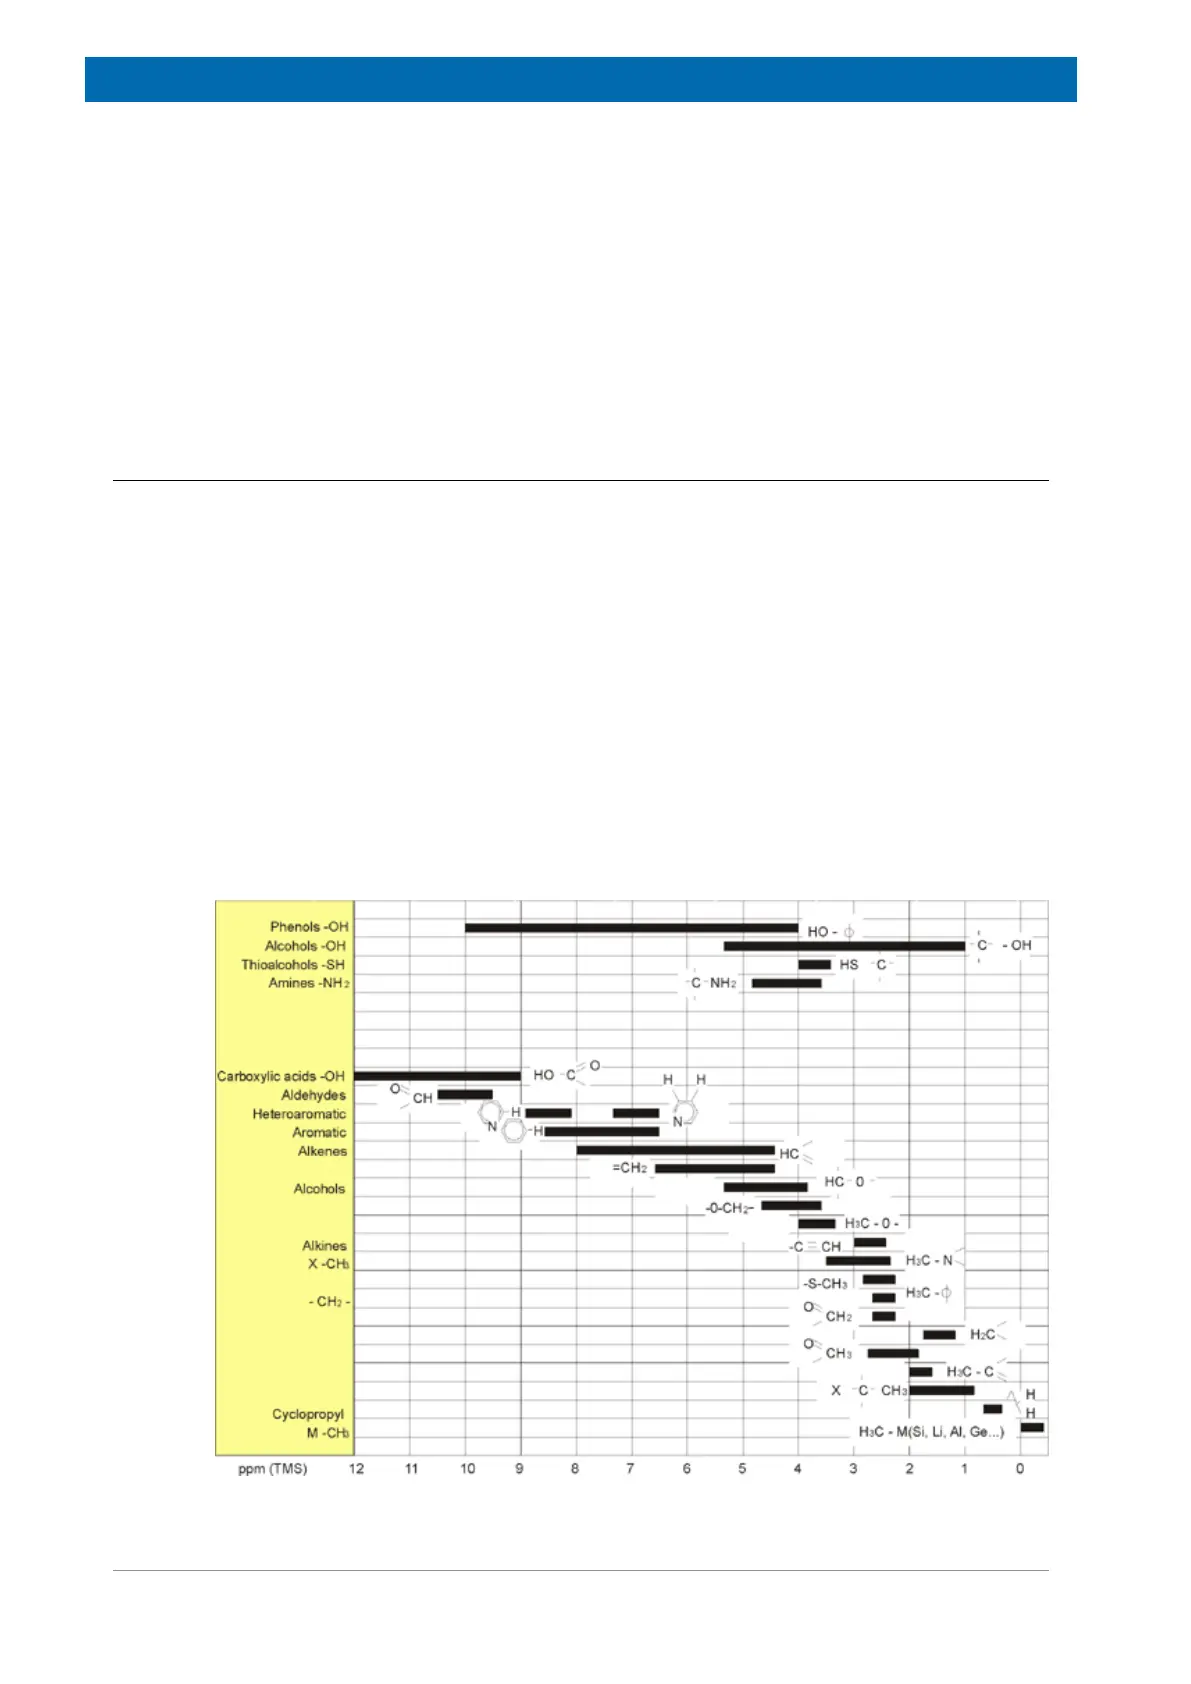
Most protons, regardless of the organic compound to which they are bonded, display
chemical shifts within 14 ppm of TMS. The figure below is an illustration of typical proton
chemical shifts in organic compounds.
Figure3.6: 1H Chemical Shifts in Organic Compounds
 Loading...