List of Figures
H171804E_14_001
77 / 86
List of Figures
Figure 3.1: Excitation and Response .............................................................................................. 9
Figure 3.2: NMR Spectrum ............................................................................................................. 10
Figure 3.3: NMR Analysis of CHCI3 ............................................................................................... 11
Figure 3.4: NMR Signals Emitted by CHCI3 ................................................................................... 12
Figure 3.5: Converting Hertz and ppm............................................................................................ 13
Figure 3.6: 1H Chemical Shifts in Organic Compounds ................................................................. 14
Figure 3.7: Benzene Ring ............................................................................................................... 15
Figure 3.8: Spectrum of Benzene ................................................................................................... 15
Figure 3.9: Benzylacetate ............................................................................................................... 16
Figure 3.10: Proton Spectrum of Benzylacetate ............................................................................... 17
Figure 3.11: Ethylbenzene ................................................................................................................ 18
Figure 3.12: Ethylbenzene Spectrum................................................................................................ 18
Figure 3.13: Decoupling Experiment................................................................................................. 20
Figure 3.14: Ethylbenzene Spectrum with Homodecoupling ............................................................ 20
Figure 3.15: Fourier Transformation ................................................................................................. 21
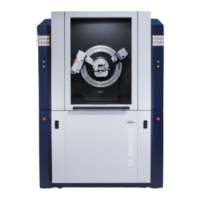
Figure 4.1: AVANCE NEO Console and Ascend Magnet ............................................................... 23
Figure 4.2: AVANCE NEO Architecture Overview .......................................................................... 24
Figure 4.3: Photo of Magnet, Shim System, Probe and HPPR....................................................... 26
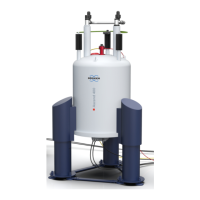
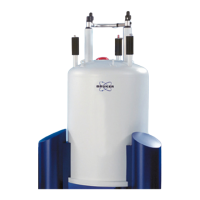
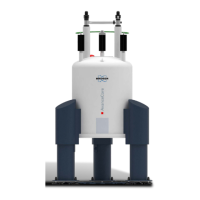
Figure 4.4: Superconducting Magnet.............................................................................................. 28
Figure 4.5: Sample in Probe ........................................................................................................... 30
Figure 4.6: Typical HPPR Cabling .................................................................................................. 31
Figure 4.7: Example of a Broadband Probe.................................................................................... 32
Figure 4.8: The Bruker iProbe Platform .......................................................................................... 33
Figure 5.1: Inserting the Sample into the Spinner........................................................................... 38
Figure 5.2: Solvents Table .............................................................................................................. 39
Figure 5.3: Lock Display after Locking the Sample......................................................................... 40
Figure 5.4: ATMM Probe Tuning/Matching Window ....................................................................... 41
Figure 5.5: Examples of Wobble Curves with Different Tuning and Matching................................ 43
Figure 5.6: The proc1d Window...................................................................................................... 45
Figure 6.1: Spectrum with BF1 = 600.13 MHz, 01 = 0 Hz .............................................................. 48
Figure 6.2: Spectrum with BF1 =600.13 MHz, 01= 8 kHz............................................................... 49
Figure 6.3: Spectrum with BF1 = 600.13 MHz, 01 = 8 kHz, SWH = 8.4 kHz .................................. 49
Figure 6.4: Interaction of SFO1, BF1 and O1 ................................................................................. 50
Figure 7.1: Spectrum Showing Spinning Sidebands....................................................................... 52
 Loading...