Preparing for Acquisition, Frequency Related Parameters
48 / 86 H171804E_14_001
6.2 Numerical Explanation of Transmitted, Basic and Offset
Frequencies
Consider a 600 MHz spectrometer used to observe hydrogen. The spectrometer is
configured to have a BF1 of 600.13 MHz (a 500 MHz spectrometer normally has a BF1 of
500.13 MHz, a 400 MHz a BF1 of 400.13 etc.).
If O1 is set to zero then: SFO1 = 600.13 + 0 = 600.13 MHz
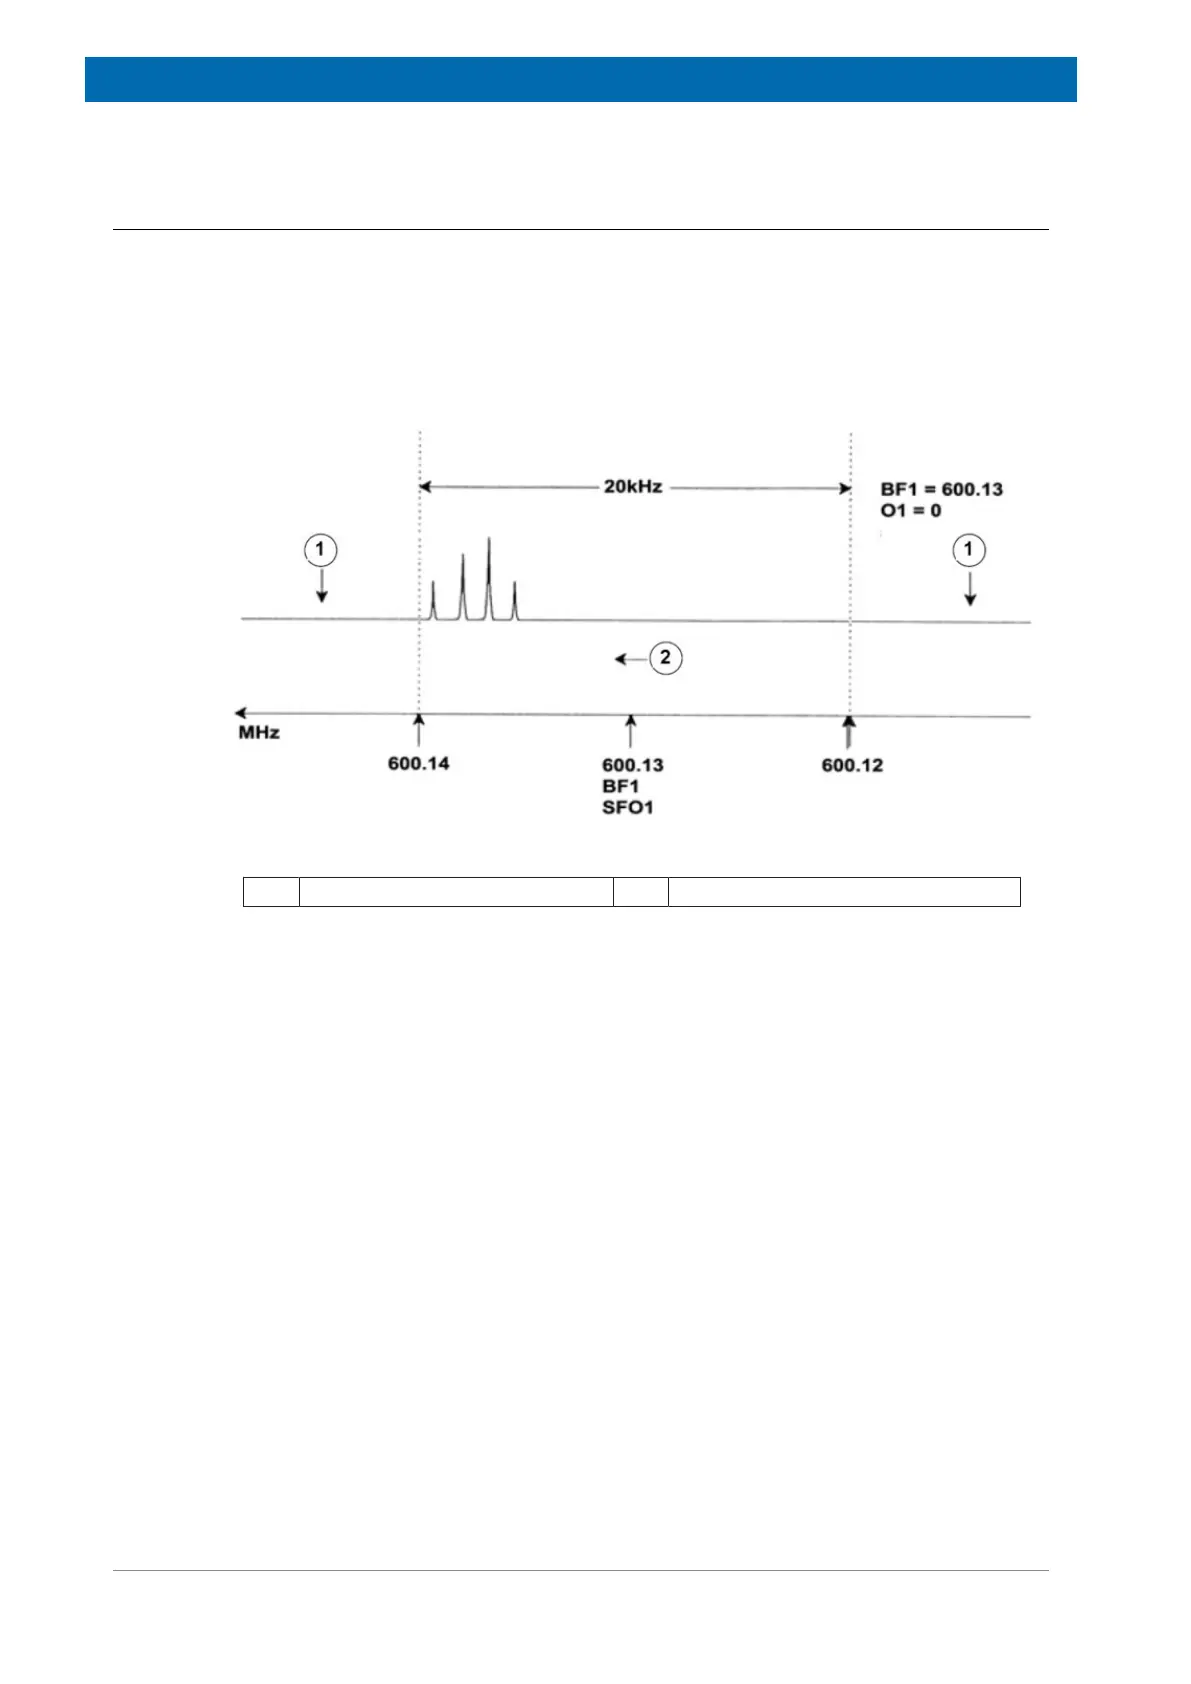
Thus the spectrum center would lie at 600.13 MHz. If SWH was set to 20 kHz, the spectrum
might look like in the picture below.
Figure6.1: Spectrum with BF1 = 600.13 MHz, 01 = 0 Hz
1. Signals filtered out 2. Frequency
It is clear from our hypothetical spectrum that the NMR signals all appear towards the high
frequency end of the spectral width. Furthermore, it is possible that some signals may appear
above 600.14 MHz and since these signals are outside the spectral window they have been
filtered out and are not observed. To check for the presence of such signals two options are
available:
• The spectral width can be increased to encompass any missing signal. This however has
disadvantages, such as the FID resolution (the lower the value of FIDRES, the better the
resolution).
• The preferred option would be to leave the spectral width unchanged, but assign a value
to O1 to shift the center of the window.
In our example, the detected signals all appear in the region of 600.138 MHz and we wish to
center the spectrum at this frequency.
=> SFO1 = 600.138 = BF1 + O1
=> 600.138 = 600.13 + O1
=> O1 = 0.008 MHz = 8 kHz

 Loading...