Proton Spectrum
H171804E_14_001 63 / 86
• On the Integration Tool bar, click Return, save region to save the integration regions.
8.5 Plotting the 1D Proton Spectra
• Expand the spectrum to include all peaks.
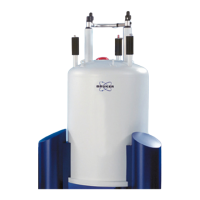
• On the toolbar, click Retain expansion and scale.
The spectrum can be printed as it is displayed in the SPECTRUM tab with a click on Print
active window .
The spectrum can also be printed with a predefined layout with a click on Export active data
or plot window as PDF .
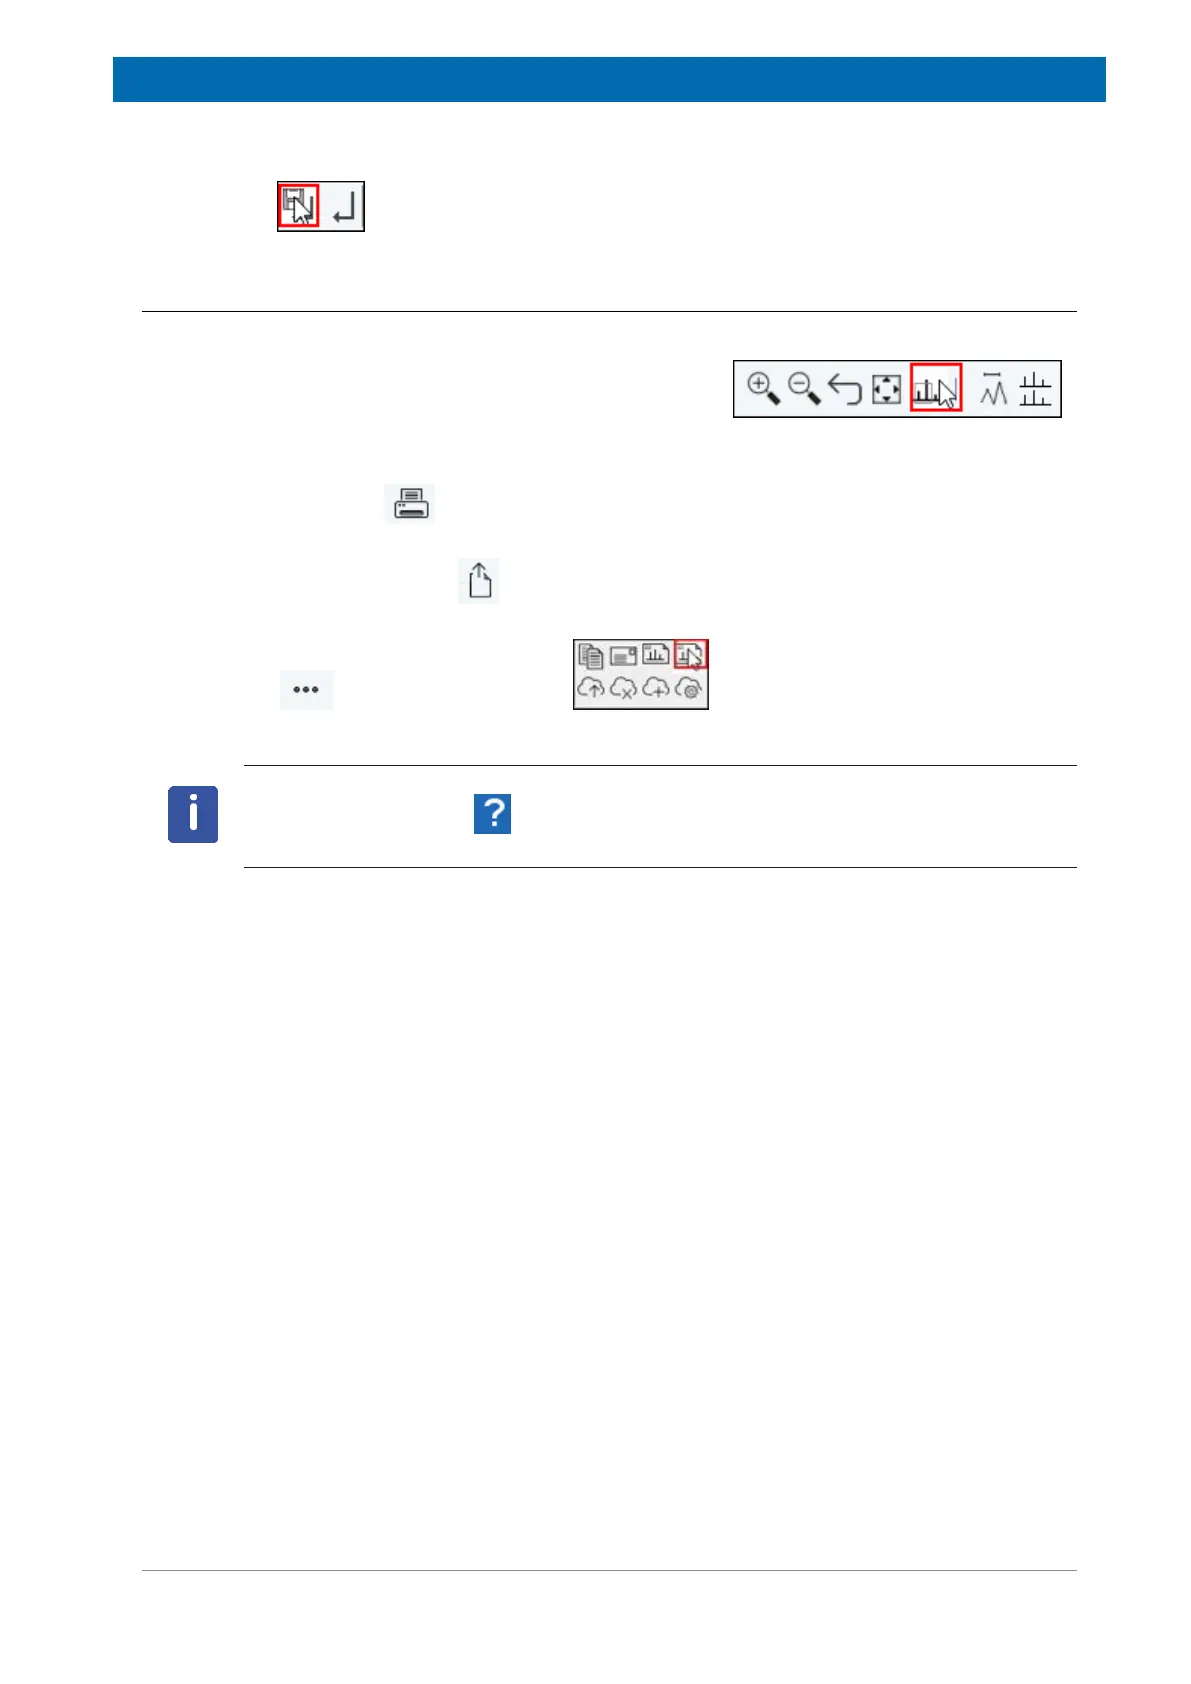
Additional options are available with the Show more Publish Options button on the menu
bar and Switch to plot editor . You may also switch to the interactive
plot editor by clicking on the Plot tab in the Dataset window tabs bar (see figure below).
For details of working with the plot editor and modifying layouts see the Data Publishing
manual in the help menu . Click Help | Manuals | Automation and Data Publishing |
Data Publishing.

 Loading...