Introductory Theory and Terminology
12 / 86 H171804E_14_001
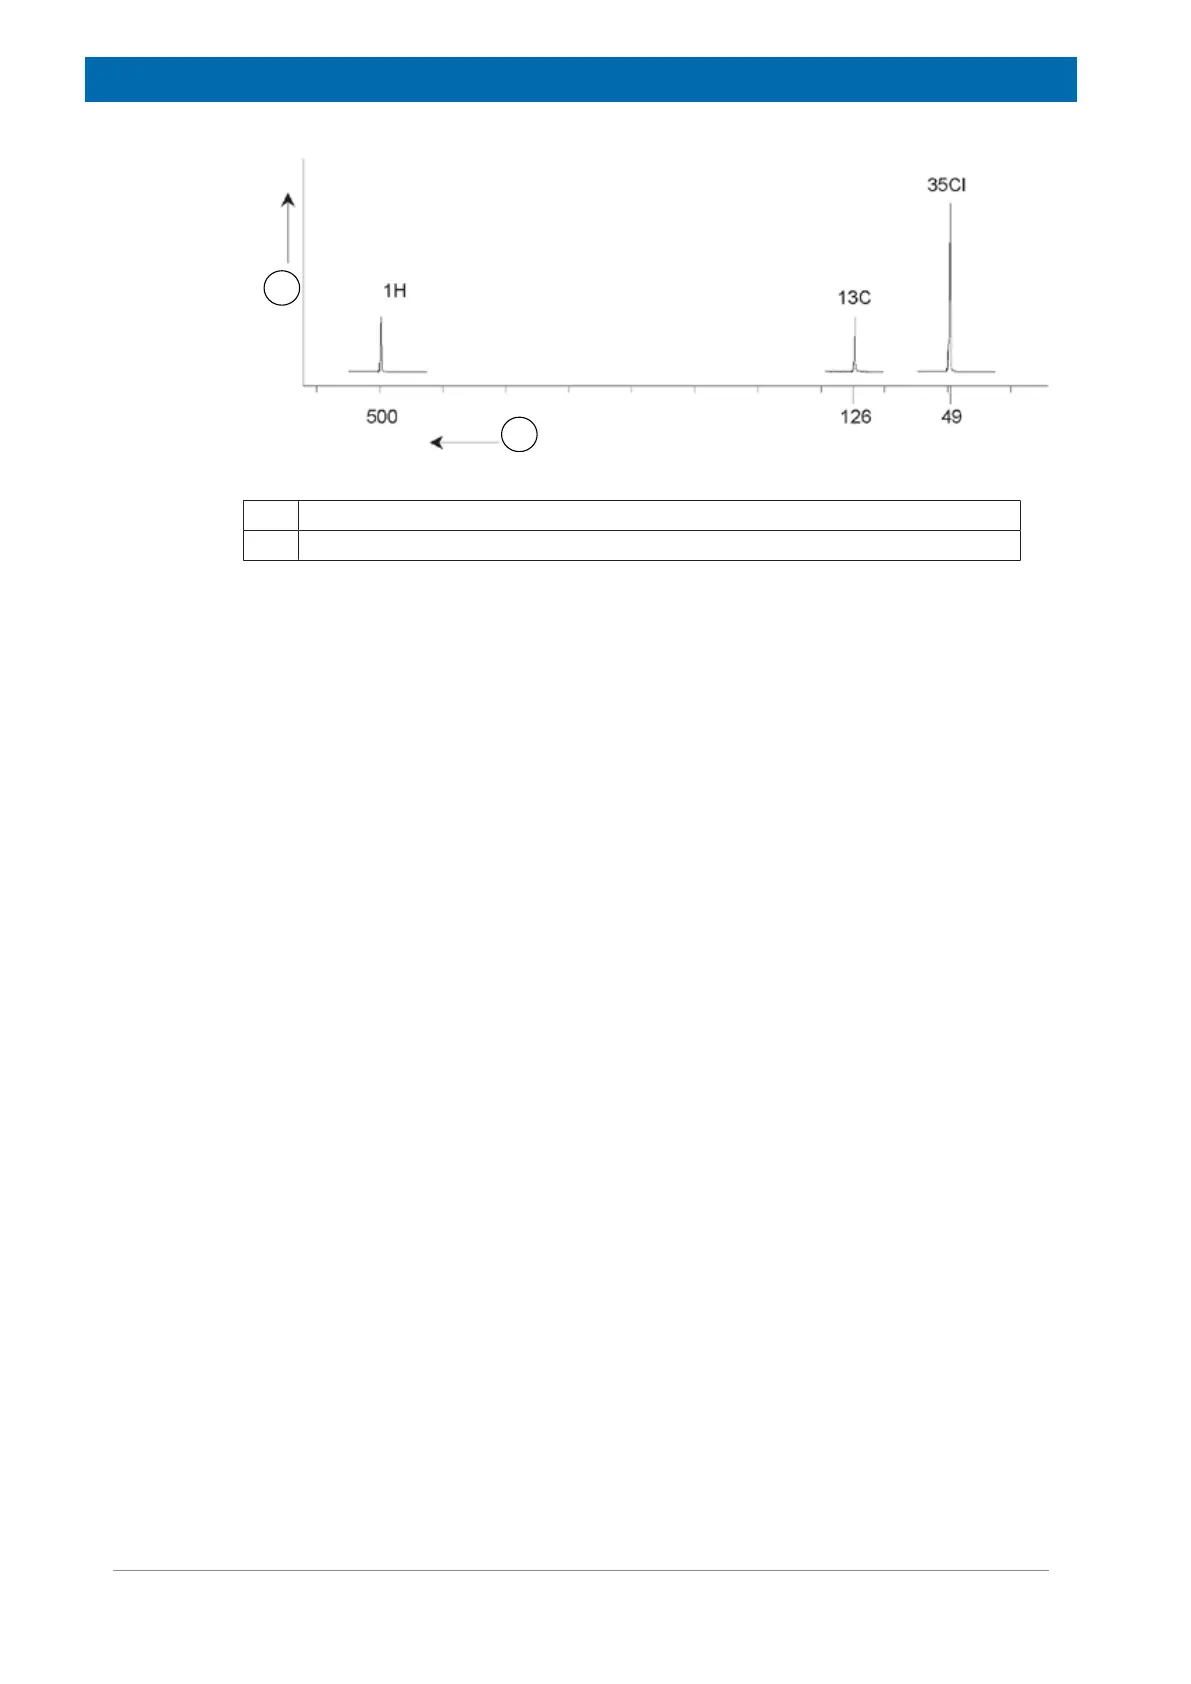
Figure3.4: NMR Signals Emitted by CHCI3
1 Intensity
2 Frequency (MHz)
This artificial spectrum shows three peaks corresponding to the three isotopes. Taking the
relative numbers of the three isotopes into account, one might expect that the intensity of the
chlorine, hydrogen and carbon peaks would be in the ratio of 3:1:1. However, the natural
abundance of the three isotopes must also be accounted for, resulting in a ratio of 227:100:1.
The user will find that the experimentally determined peak intensity ratios will not agree with
these values. The reason is that every isotope has an inherent sensitivity to the NMR
technique. The
1
H is 63 times more sensitive to NMR than
13
C. Thus, even if a sample would
contain the same number of
1
H nuclei as
13
C, the intensity of the
1
H signals will be 63 times
greater than the
13
C signals.
With a plot, such as that in the figure above, any detailed information will be lost and precise
determination of a frequency would be impossible. The spectrum would be said to display
very poor resolution (the horizontal resolution of a spectrum is a measure of how well the
spectrum differentiates between two signals that are close in frequency).
A further complication is the huge range in vertical scaling. The variation in inherent
sensitivity to NMR, coupled with the variations in natural abundance, will often make the
plotting of signals from different isotopes onto a single plot unfeasible. In fact, the vertical
resolution of the spectrum will be very poor (the vertical resolution, i.e. the signal to noise
ratio of a spectrum is a measure of sensitivity).
If our analysis of chloroform is proving rather complicated, it is because we are attempting to
compare the signals from three different observe nuclei on a single spectrum (we are ignoring
here any hardware/electronic restrictions). Therefore, in practice, NMR experiments are
performed with a single observe nucleus. Although more than one isotope may be excited
simultaneously, by using more than one carrier frequency (e.g. decoupling experiments), we
only ever observe the signals from a single isotope. This greatly simplifies spectrum analysis.
It was mentioned earlier that variations in the basic resonance frequency due to the local
atomic environment tend to be relatively small. Thus, large spectral ranges will not be
encountered. Furthermore, natural abundance and inherent sensitivity will always be the
same for an isotope. Hence, the relative intensity of say two signals emitted from
1
H isotopes
on a single spectrum will depend only on the number of atoms contributing to the signal. This
greatly simplifies analysis of spectra for quantitative information. Before proceeding further
with a more detailed description of NMR the reader should become familiar with the concept
of measuring signals in ppm (parts per million) with respect to a reference signal.
 Loading...