833-3577 CB-FALCON SYSTEM OPERATOR INTERFACE
65-0296—01 14 750-241
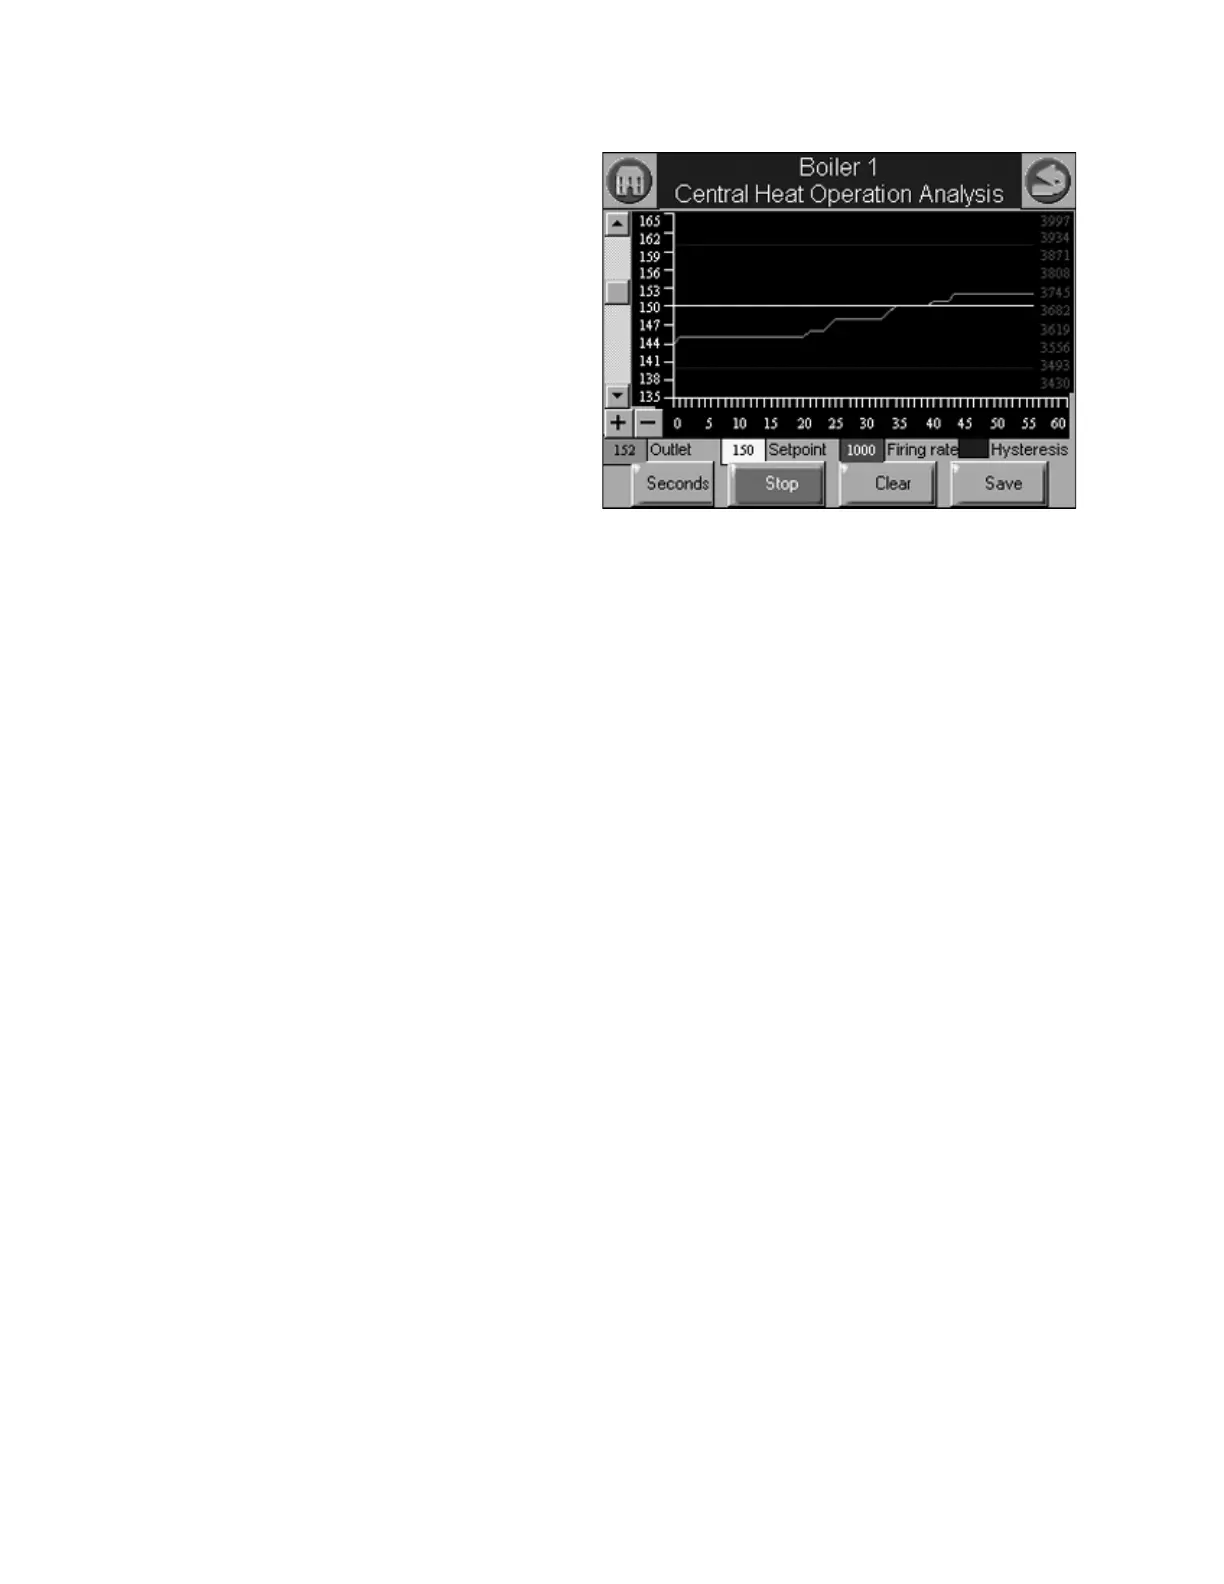
A 2-dimensional graph with status data values shown on the Y
axis over time specified on the X axis is displayed. Status for
the most recent time is represented on the left side of the
graph with older status running towards the right side of the
graph.
Fig. 27. Trend analysis page.