Section 2 — Installation
2-26 Part No. 750-263
Table 2-13: Maximum flow rate through ClearFire boilers (U.S. flow rates)
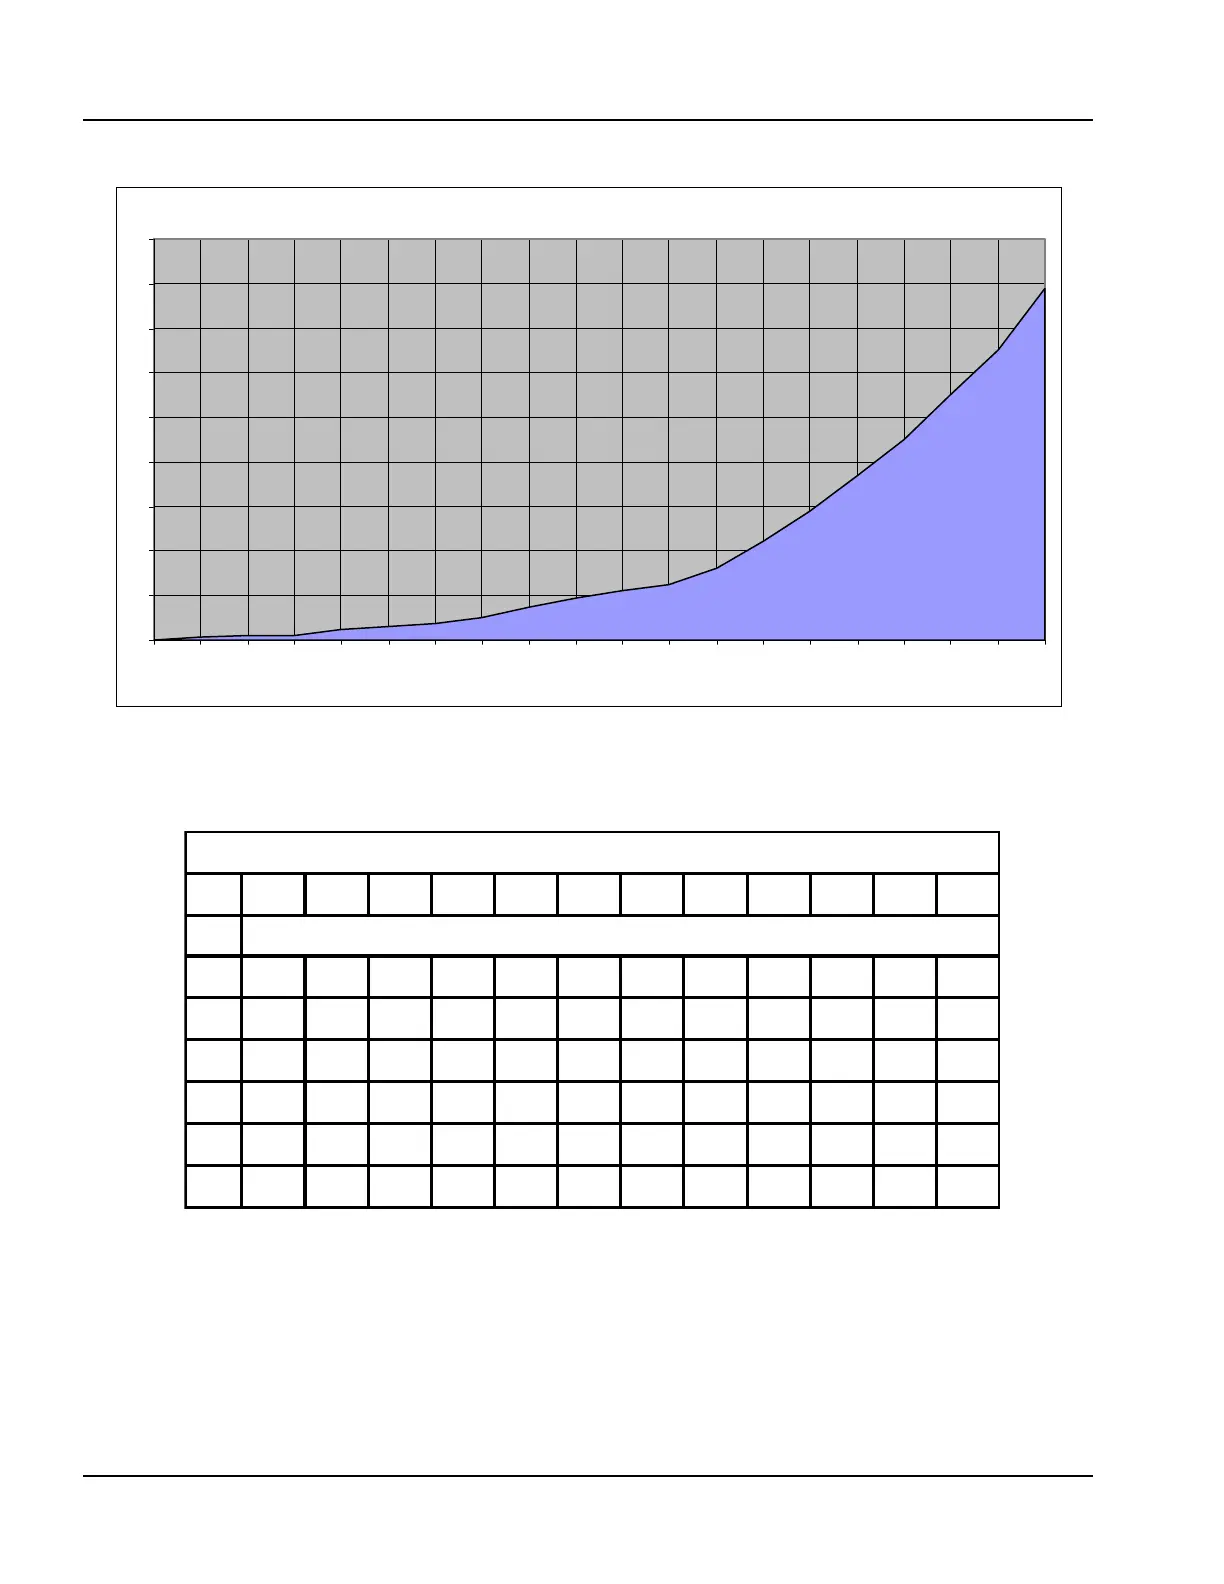
Figure 2-26 Pressure Drop Curve, CFC 2500, U.S. Flow Rates
Hydraulic Resistance CFC 2500
U.S. Standards
0
0.2
0.4
0.6
0.8
1
1.2
1.4
1.6
1.8
0 44 66 88 118 132 154 176 198 220 242 264 286 308 330 352 375 395 420 474
Flow - GPM
Pressure - PSI
10 20 30 40 50 60 70 80 90 100 110 120
500954833241916121110.59 8 7
750
1316644332622191615131211
1000
1768859443529252220181615
1500
260 130 87 65 52 43 37 33 29 26 24 23
1800
351176117887059504439353230
2500 470 235 157 118 95 79 67 59 52 48 43 39
Recommended flow rates relative to temperature drop so as not to exceed boiler output.
Flow Rate GPM
System Temperature Drop
0
F
Boiler
Size