CUBE 30 TOUCH | USER MANUAL
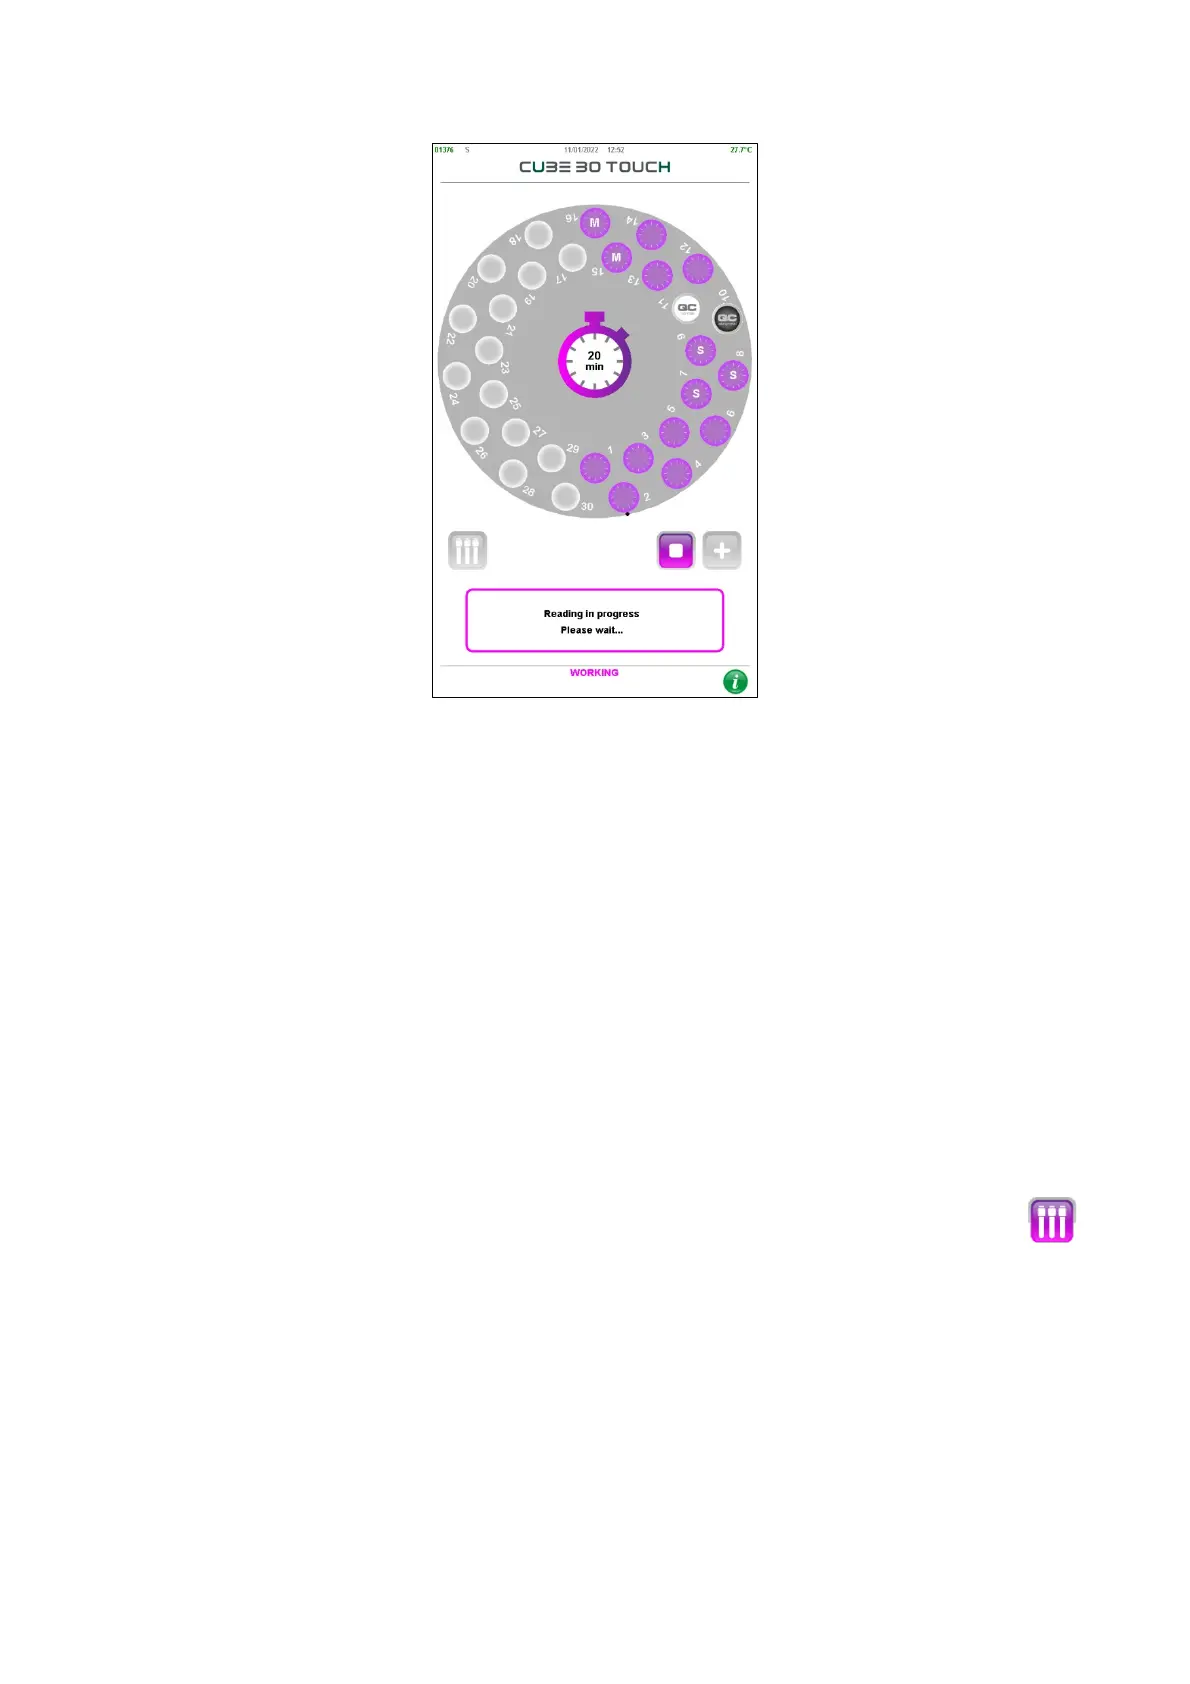
Figure 33 – Time reading t=0
If a volume of blood between 1ml and 1.5ml is detected in Normal type tubes, another
lower light scan will immediately follow.
The log file will contain the data for both scans: the scan used to calculate the ESR is the
second one with lower light.
A 20-minute countdown begins at this point with the remaining sedimentation timer
located in the center of the carousel (Figure 33)
With reference to Figure 33, the two positions of the black and white circle in the
samples plate represent two Quality Controls, respectively, Pathological (Abnormal) QC
and Normal QC
The user may switch from the “Carousel view” to the “Tube view” (Figure 34) with
button.