CUBE 30 TOUCH | USER MANUAL
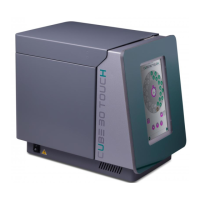
Figure 64 - Qc detail
By selecting the 'Export' button , it is possible to print the QC.
By pressing the 'Graph' button , the user enters the "QC History" page where the QC
data are displayed in a Levey-Jennings graph (Figure 65).
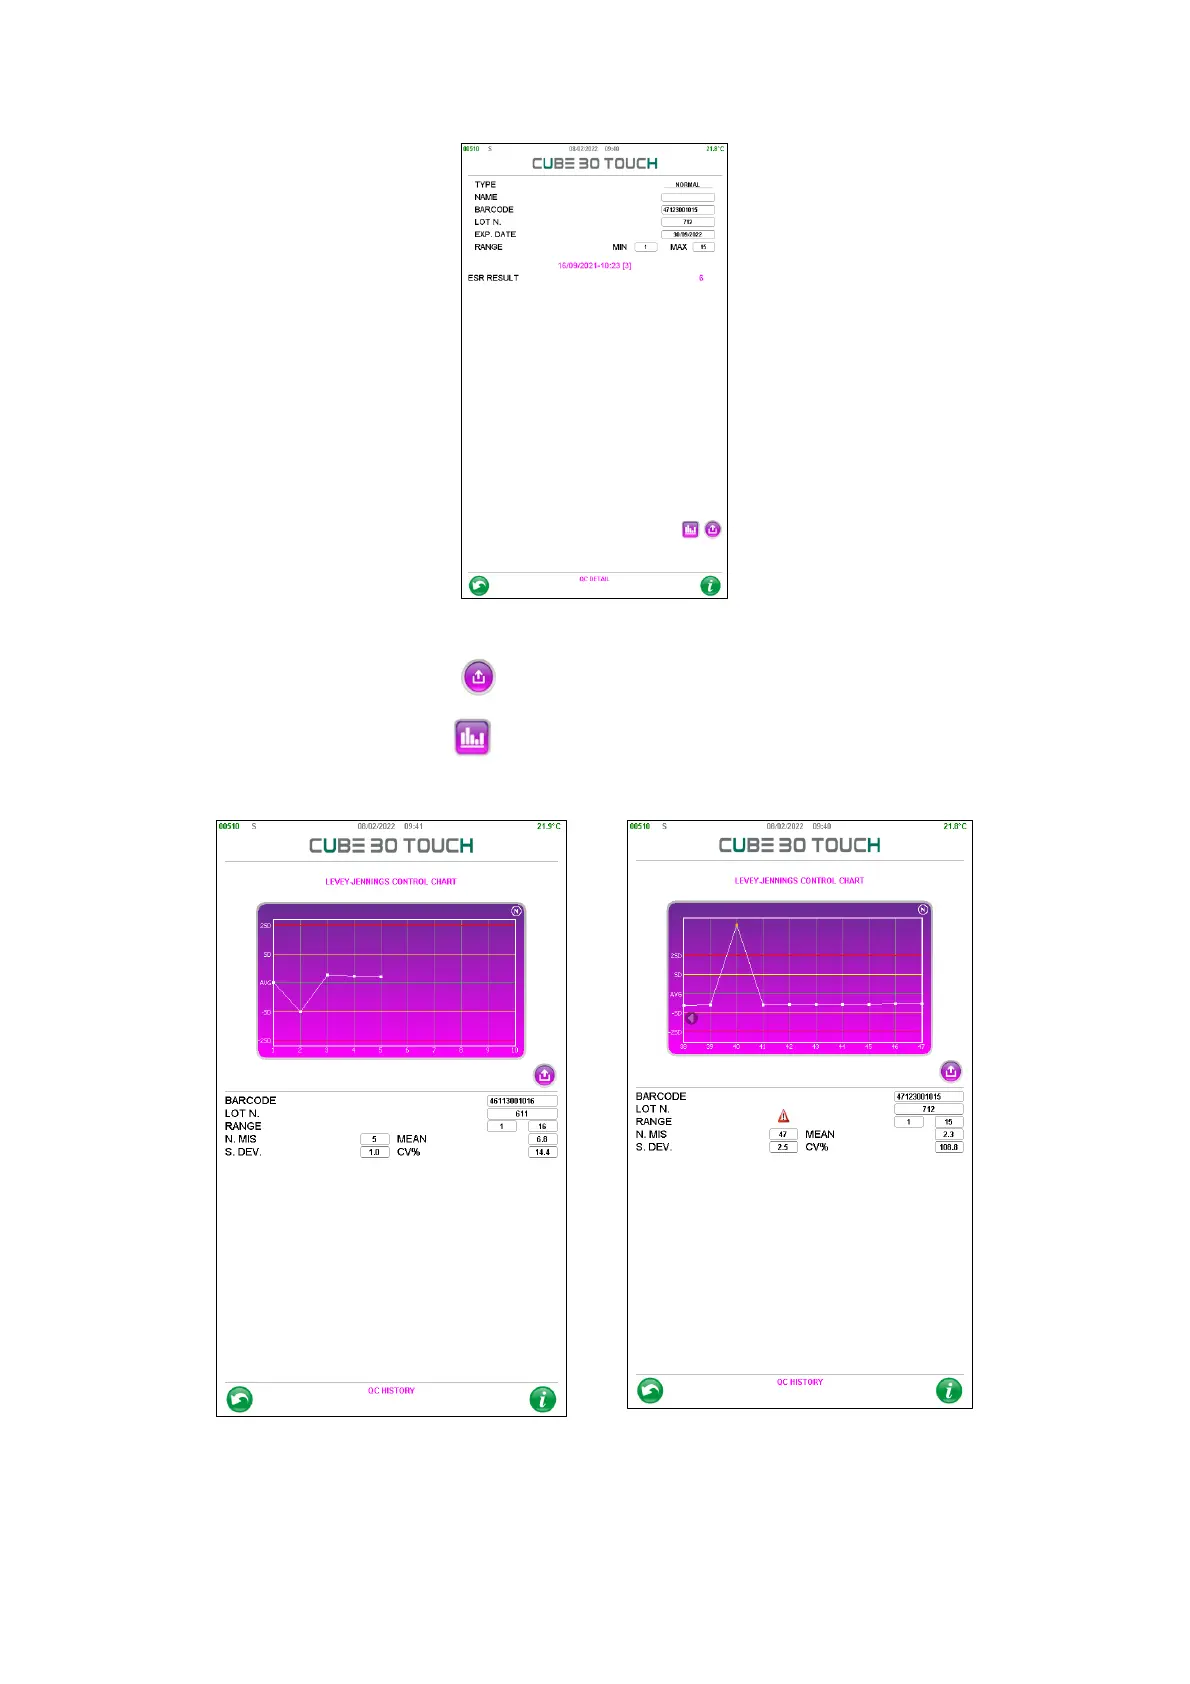
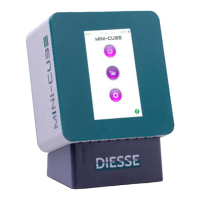
Figure 65 - Qc history
This page shows the details of the QC (barcode, lot and limits), the number of
measurements performed, the mean, the standard deviation and the CV%. The Levey-