described in the following sections). In addition, the graph displays the resulting sum of all input to the
eq curve (in black), which includes auto eq, Grossman eq, graphic eq, bass and treble, and output level.
The x-curve is displayed in magenta (as it is in the other equalization screens).
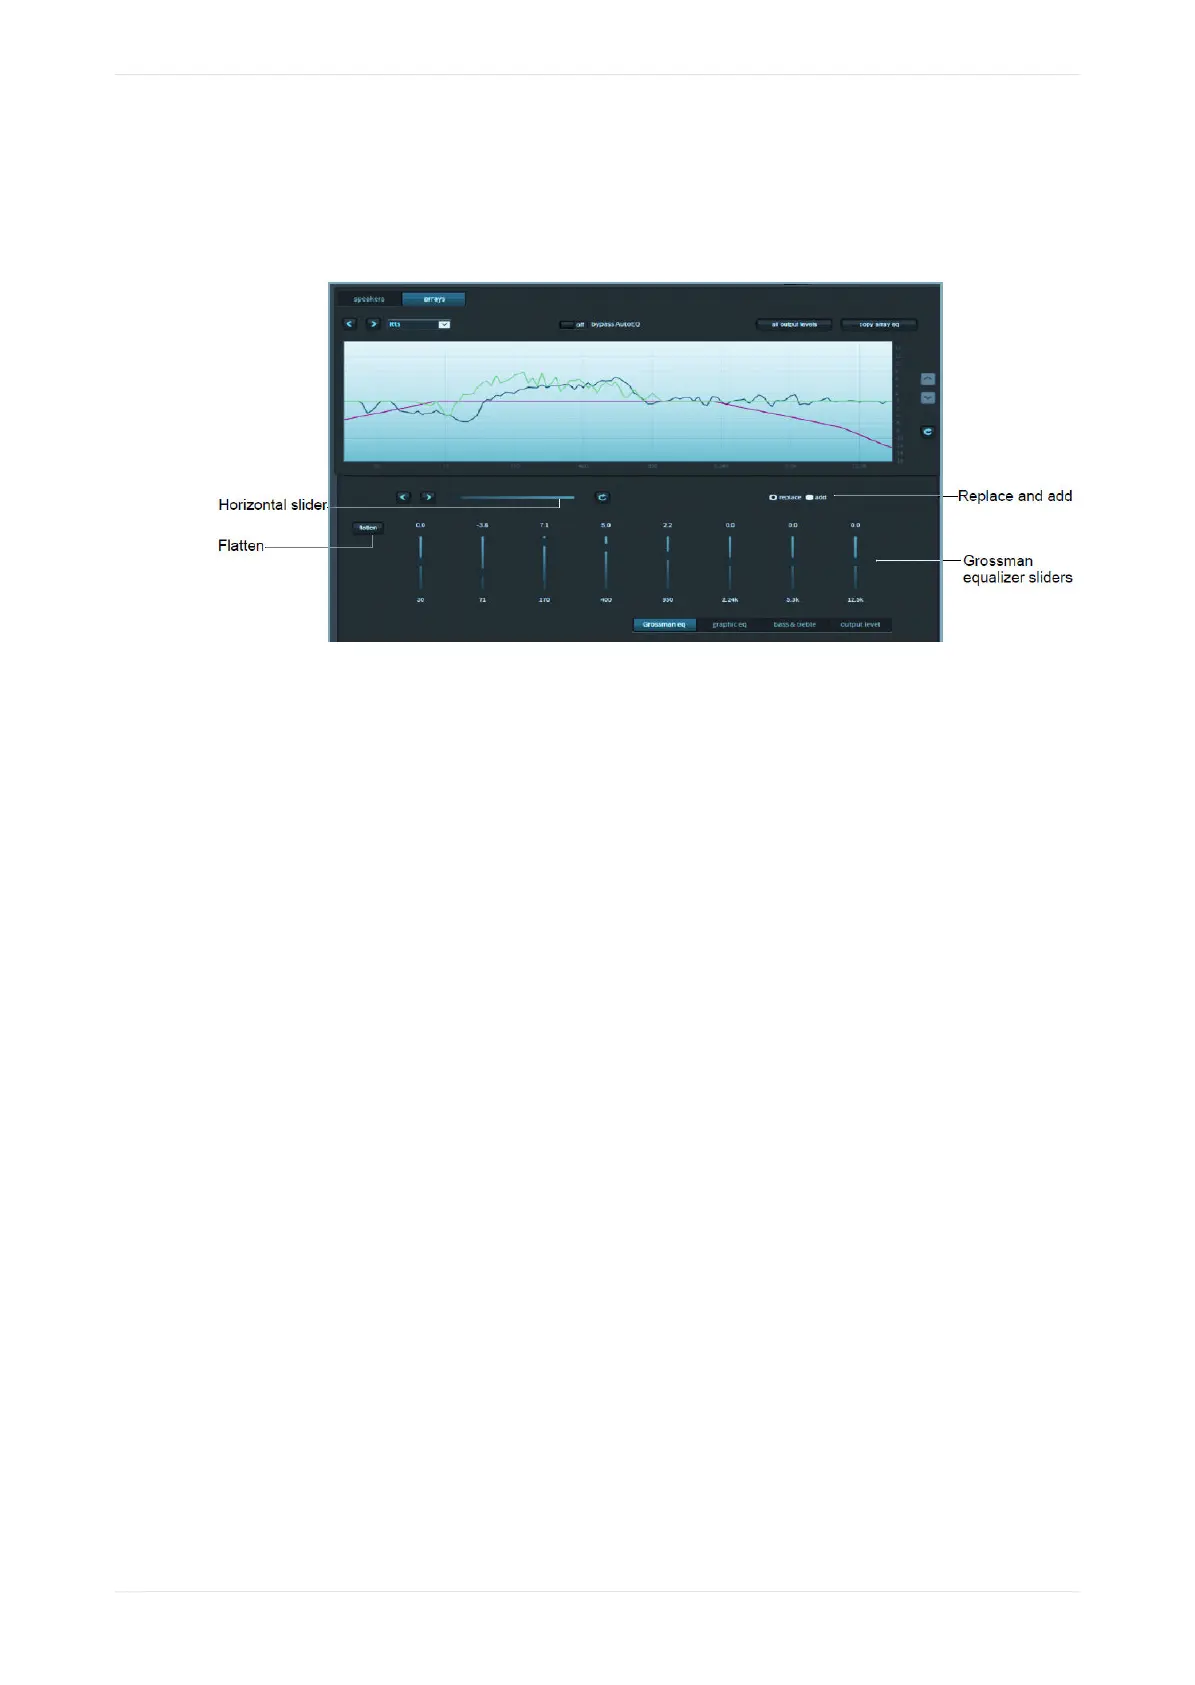
Figure 127: Grossman EQ Screen
Following is a description of the controls in the Grossman eq screen, as shown in the previous figure.
Grossman equalizer sliders
You can drag the Grossman equalizer sliders to adjust the gain throughout the range of frequencies shown on
the graph.
The number above each of these sliders represents the position of the slider from -10 dB gain to +10 dB gain.
This corresponds with the center band of all bands that the slider represents. The number below each of
these sliders denotes the frequency (Hz) of the center band of all bands represented by that slider.
Horizontal slider
The horizontal zoom slider aects the number of one-twelh octave EQ bands that you control with the
Grossman equalizer sliders.
When you move a slider slowly to the right, the number of bands decreases by 1. At its lemost position, the
slider corresponds to 15 bands per slider, and at its rightmost position, it corresponds to one band per slider.
Note that each slider may aect more than this precise number of bands, due to smoothing of the EQ curve.
You can zoom in and out to keep the center band of the graph constant as far as possible. (It must also adjust
for either end of the graph while zooming out.)
Panning aects which bands the sliders manipulate. You can also pan around (when not fully zoomed out) by
dragging the graph le and right, or by using the arrow buttons next to the slider. The arrow buttons move
the graph le or right one band at a time.
The refresh button resets the zoom slider back to 15 bands per slider.
Replace and add buttons
These buttons denote two modes of operation.
When you click replace and move an equalizer slider to a dierent position to change a setting, this replaces
the Grossman band gains (the green plot only) with the new setting. When you click add and move a slider to
a dierent position, this adds the new changes to the existing Grossman band gains. Note that in add mode,
it is possible to set band gains beyond the range of the sliders, that is, beyond the [-10 dB, +10 dB] range. In
such a case, the Grossman band gains (only the green plot) are saturated at +10 dB or -10 dB. Grossman eq
remembers the shape of the curve before it was saturated, so if you reduce the level (which desaturates), the
original shape is retained.
Configuring the equalization parameters
Dolby Cinema Processor CP950 and Dolby Atmos Cinema Processor CP950A Manual 96
Issue 9 Part Number 8800298 19 January 2022