User Manual AUTOMATION February 16, 2010
Xynergi Media Production Centre Page 160
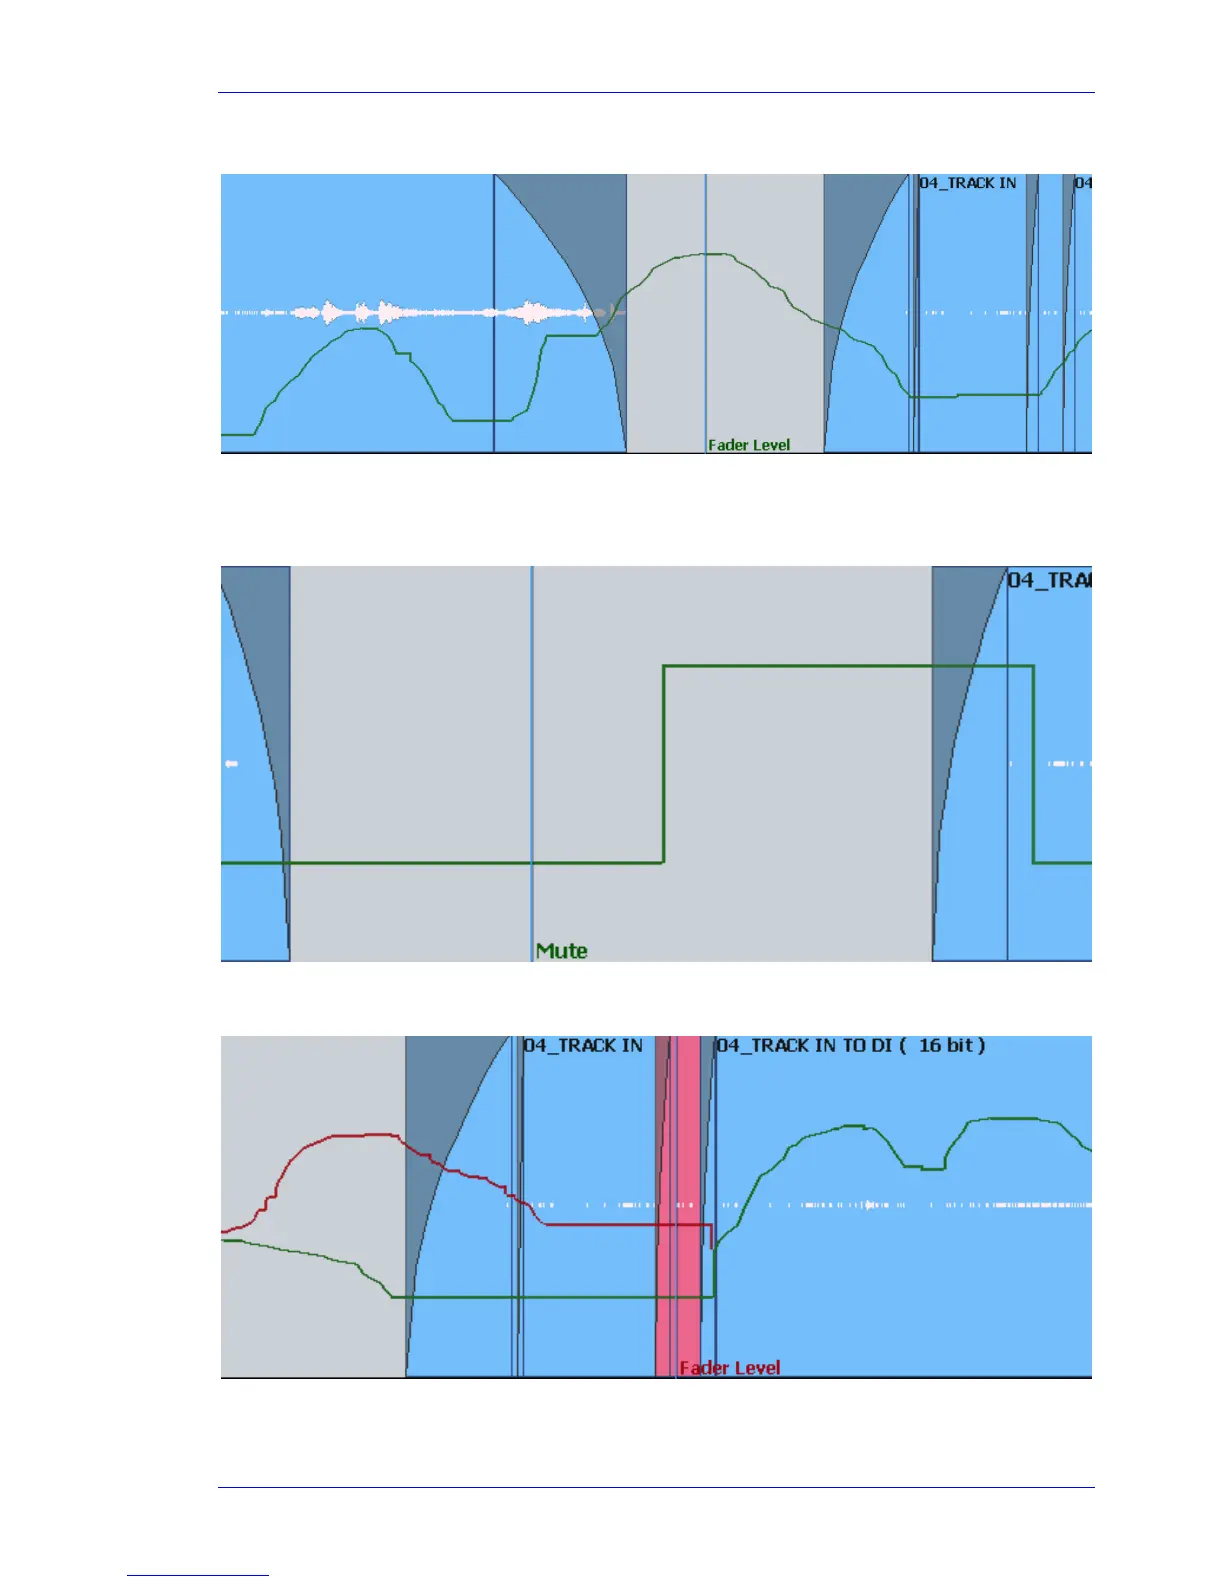
The Curve Display
Automation data is shown as a green line, with the name of the parameter to the right of the cursor.
For switched parameters like Mutes, the line is shown high when the channel is on, and low when it is
muted, as shown below.
When writing automation, the graph is shown in red. Existing automation data is shown in green,
allowing you to target punch out points easily.
Note that, in this case, the red line continues past the cursor. This shows accurately what will happen
when Write is exited, because the system On Stop setting is EVENT, meaning the current value will be
held until the next change in automation value.