User Manual HOW TO … February 16, 2010
Xynergi Media Production Centre Page 94
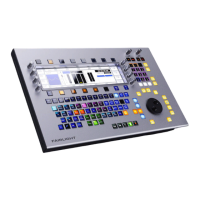
Note that, in this case, the red line continues past the cursor. This shows accurately what will
happen when Write is exited, because the system On Stop setting is EVENT, meaning the current
value will be held until the next change in automation value.
Here is how it looks when On Stop is set to HOLD:
In this case the red line continues at the same value to the end of the screen, because this value
will be written to the end of the project.
Editing Automation Curves
Automation data can be edited graphically using the mouse. To do this, click the Edit button.
There are two ways to edit, Events and Draw.
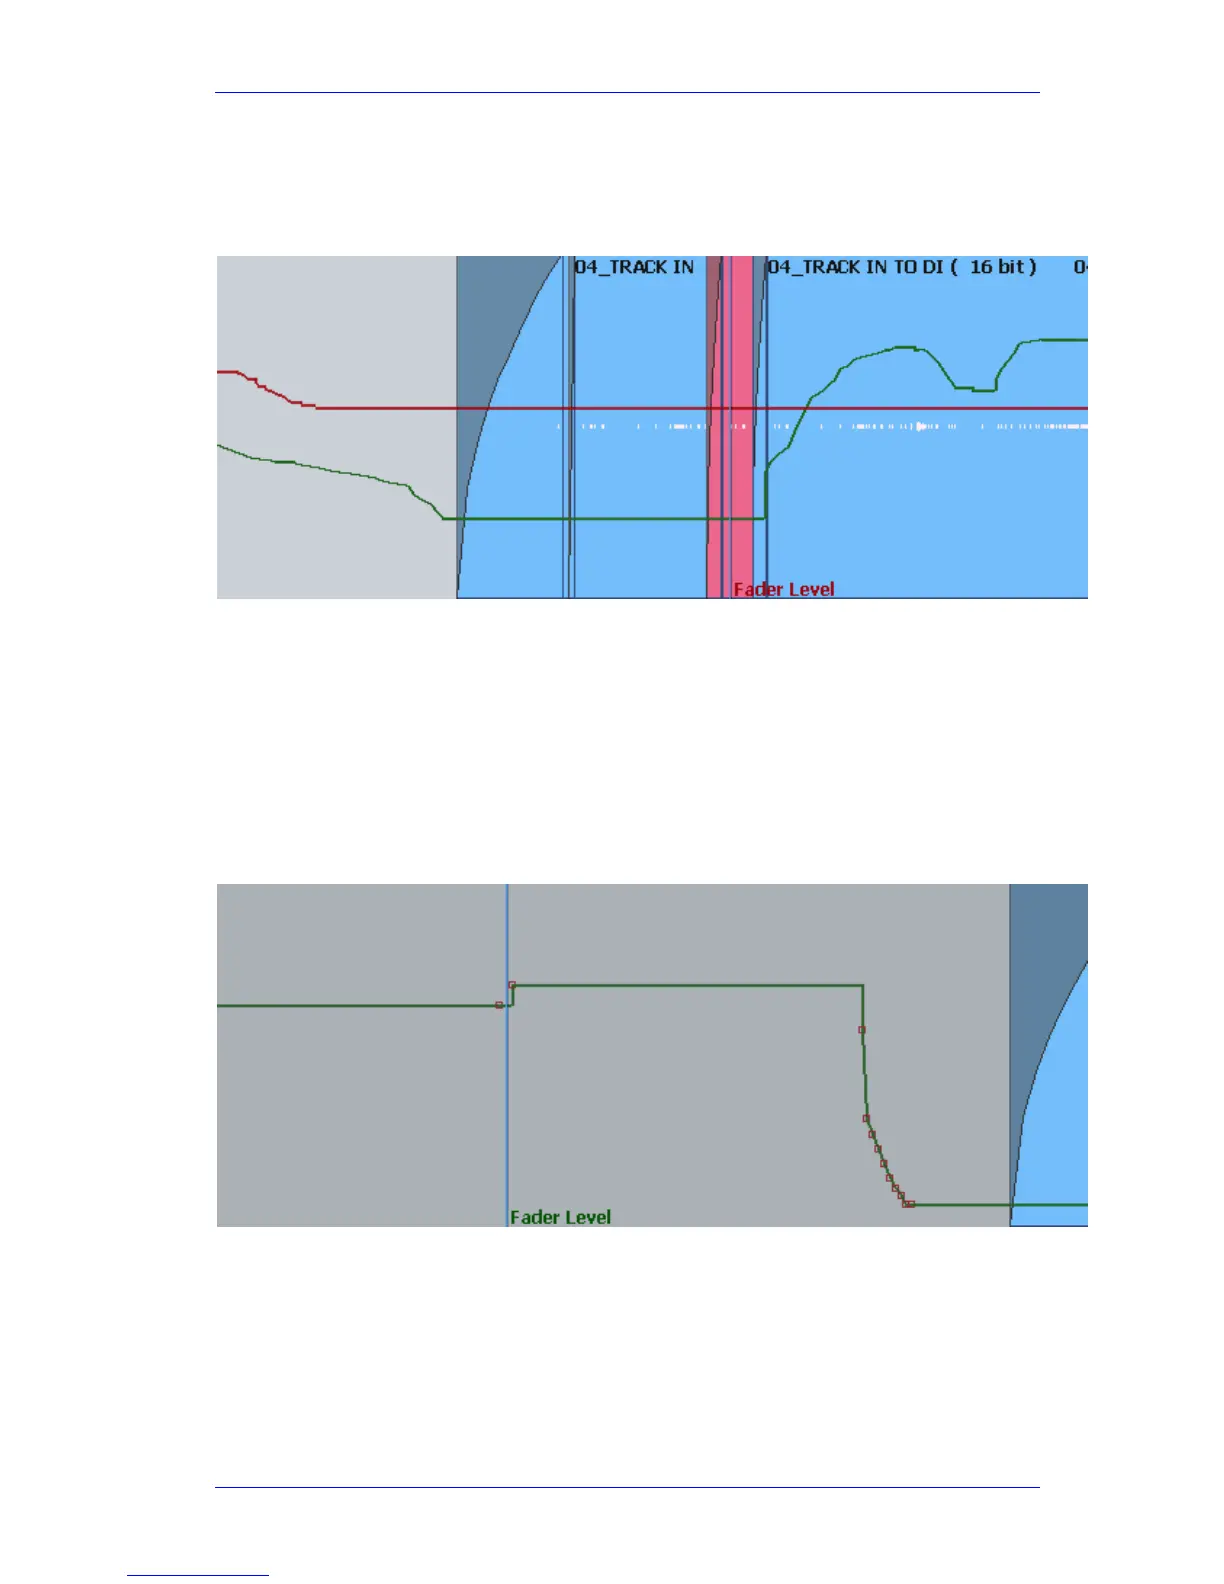
Events
To edit Events, click on the Events button.
Events are shown as red squares. Note that each event is a value of the parameter. After an
event the value stays constant until just before the next event, when it ramps up or down to the
next value. When events are close together, as shown above, they are joined by a smooth line,
reflecting this ramp. Otherwise the values are held constant and shown with a horizontal line.
While Events are displayed you may do any of the following:
Move an individual event with the mouse.