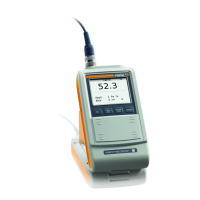
Page 216 Operator‘s Manual FERITSCOPE
®
FMP30
Glossary
where:Fe..: Mean vale of the group mean values
Cp: process capability index
Cpk: critical process capability index
USL: upper specification limit
LSL: lower specification limit
: estimated value for the theoretical standard deviation
Process control chart (quality control chart, SPC chart)
Statistical Process Control (SPC) often uses random samples to control a
production such that the production process is under statistical control.
To do this, the variable features of the manufactured product are entered
in a process control chart. Process control charts plot process variation
over time and help to identify the causes of variations. A random sample
is taken from the production process, is measured and the result (e.g.,
mean value and standard deviation (x-s chart)) is graphically document-
ed. The results of the control chart are used to determine when action
should be taken in the process.
Quality assurance
All measures taken by a producer to ensure a controlled production pro-
cess within the established quality criteria. One aspect of it is quality
control, specifically, -ferrite content measurements where ferrite content
limit specifications are involved.
Quality control chart Process control chart (quality control chart, SPC chart)
R
Range R of all measurements being displayed in the process control
chart. The range is the difference between the maximum measurement
Fe
max
and the minimum measurement Fe
min
in a measurement series.
R.
Mean range across all block ranges.
p
OGW UGW–
6
ˆ
------------------------------------=
pk
Min
OGW Fe..–
3
ˆ
-------------------------------
Fe.. UGW–
3
ˆ
-------------------------------
;=
ˆ
ˆ
RFe
max
Fe
min
–=

 Loading...