EasyManuals Logo

Fronius Datamanager 2.0 User Manual

Fronius Datamanager 2.0
102 pages
To Next Page IconTo Next Page
To Previous Page IconTo Previous Page
Page #57 background imageLoading...
Page #57 background image
55
EN-US
Current Data in Fronius Datamanager 2.0
Current Compari-
son View
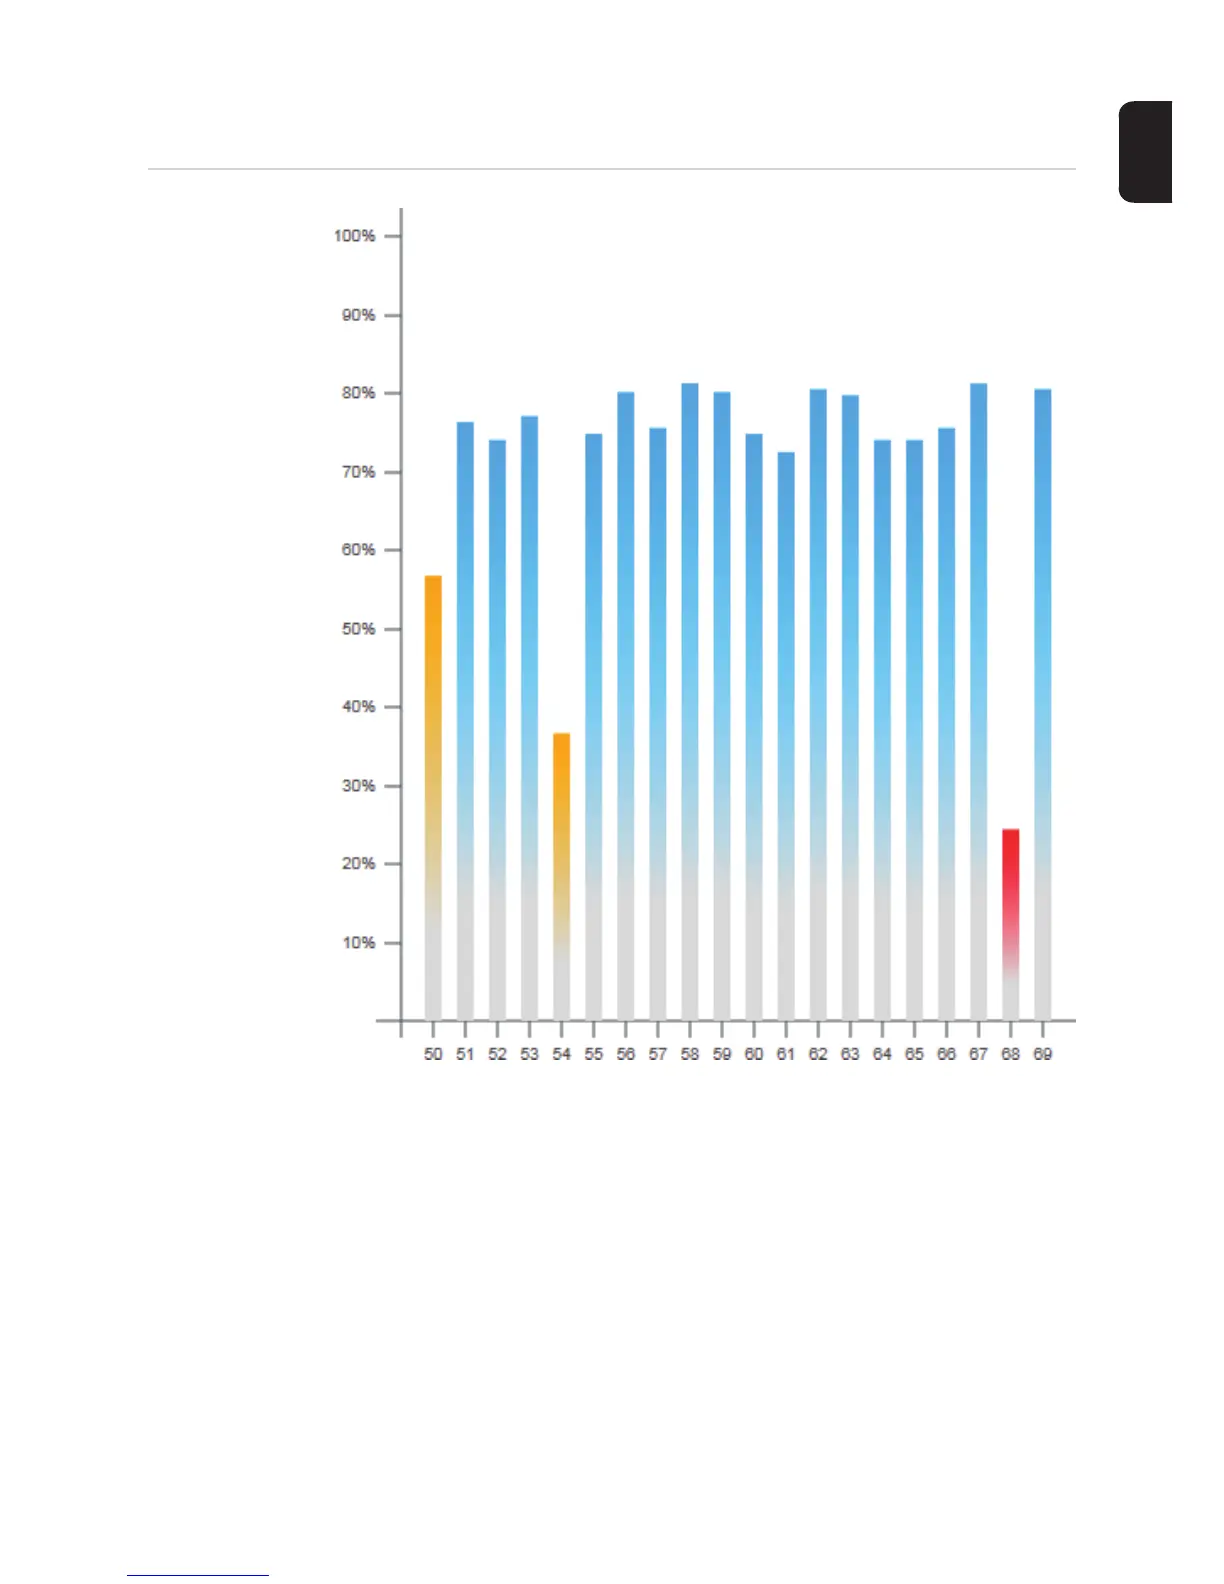
Several inverters in the same photovoltaic system can be compared in the current Com-
parison View.
The real-time inverter AC power is displayed as a percentage of the power from the solar
module connected to the respective inverter (shown in a bar diagram). A bar is displayed
for each inverter. The bar color indicates the power range of the inverter:
Blue: the inverter power corresponds to the average power of all inverters.
Yellow: the inverter power deviates slightly from the average power of all inverters
(50–90% from the average).
Red: the inverter power deviates significantly from the average power of all in-
verters or an error has occurred in the inverter
(< 50% from the average).

Table of Contents

Other manuals for Fronius Datamanager 2.0

Questions and Answers:

Question and Answer IconNeed help?

Do you have a question about the Fronius Datamanager 2.0 and is the answer not in the manual?

Fronius Datamanager 2.0 Specifications

General IconGeneral
Monitoring PlatformFronius Solar.web
Communication InterfacesEthernet
ProtocolsModbus TCP
Data LoggingIntegrated data logger
Web InterfaceYes
CompatibilityFronius inverters
Power SupplyVia inverter
MountingWall mounting

Related product manuals