198 43-TV-25-30 Iss.6 GLO Aug 07 UK
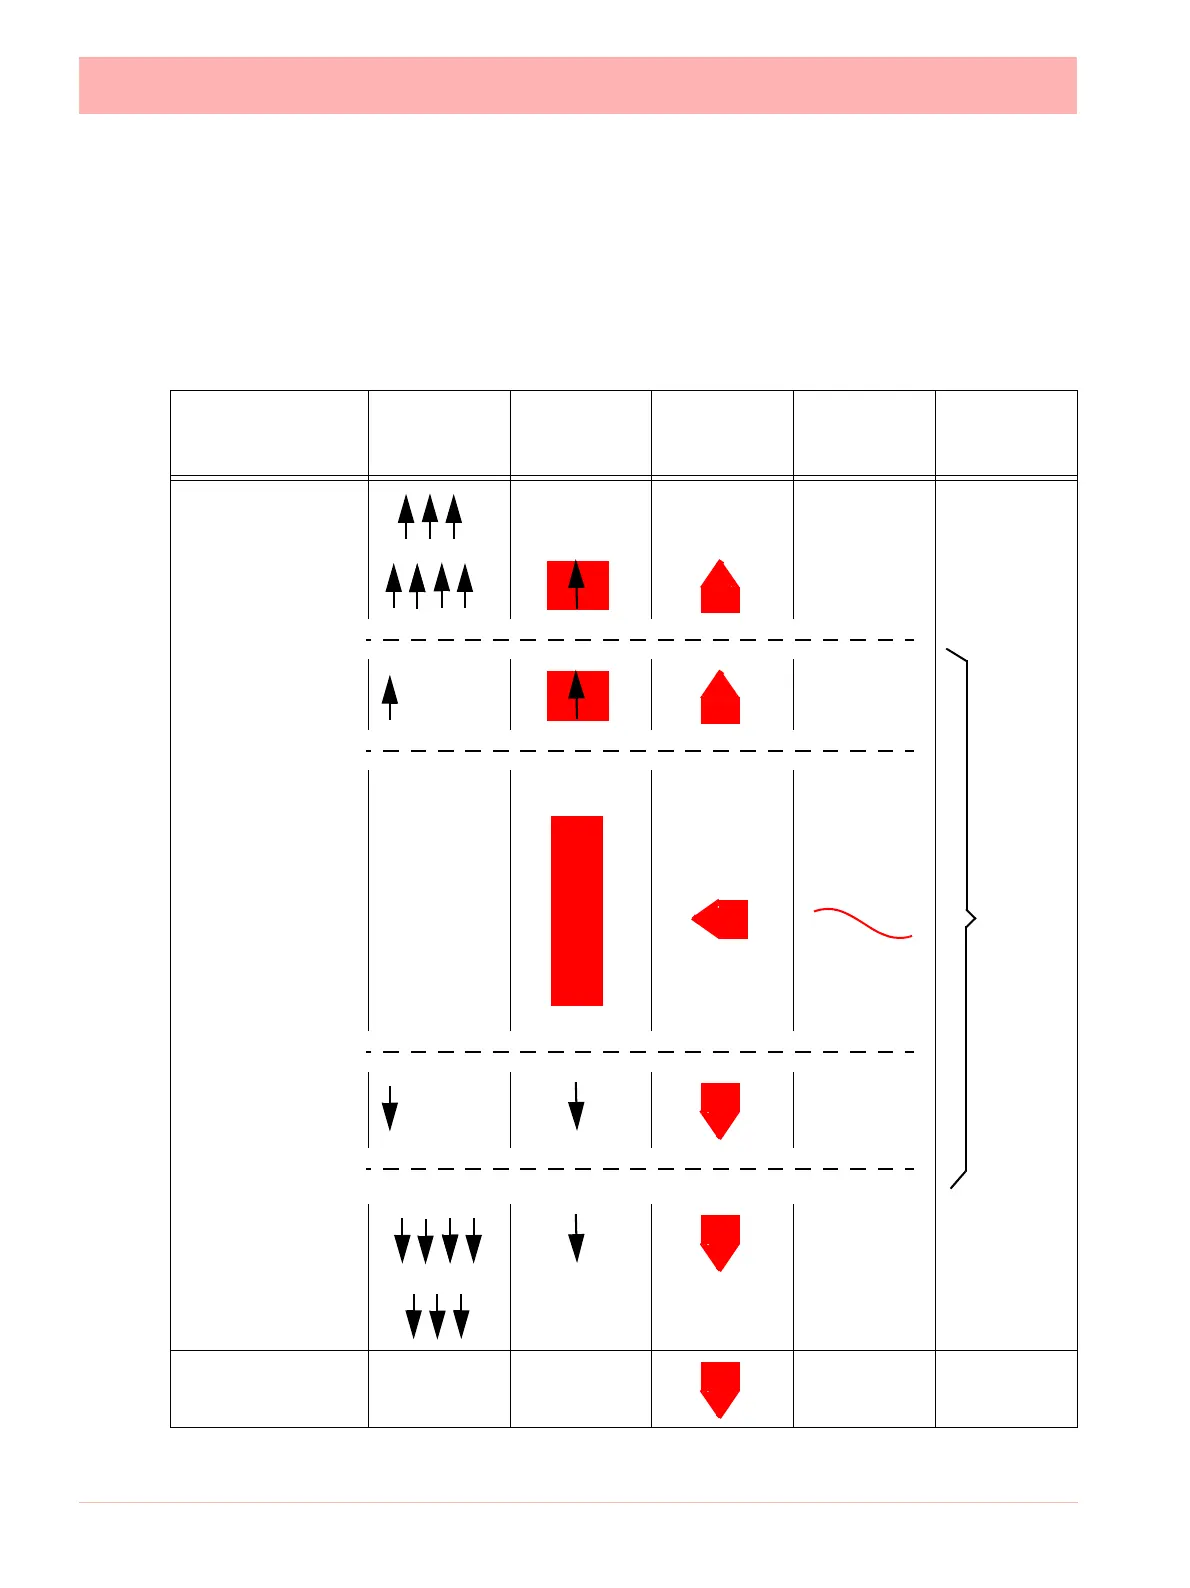
Screen Markers
Table 6.2, “Screen Markers,” on page 198 shows different types of markers that may
appear on the screen during normal data activity and where they would appear.
The markers change depending on if the signal goes High or Low, outside the Pen Scale,
or outside the Input Range.
Note: It is recommended to display DPMs on a chart to identify over-range and under-range
activity.
Table 6.2 : Screen Markers
DPM Bar
Pointer
(horizontal
chart)
Chart
Upscale Burnout
Outside Range High Trace at Max
Input Range Top
Trace at Max
Pen Scale Top
Displays as normal
1234.567
Bar
Trace
Pen Scale Bottom
Trace at Min
Input Range Bottom
Outside Range Low Trace at Min
Down scale Burnout
Invalid Reading Trace at Min
Valid
Data
1234.567
1234.567
**** ****
 Loading...