62 43-TV-25-30 Iss.6 GLO Aug 07 UK
Data Error box
If incorrect vales are entered a Data Error box will appear saying “Data line * is invalid”. This will appear
when you select the tick box at the bottom of the screen. The error box will indicate which line has the
error. There may be more than one error in the table, if so the data error message box will appear for
each error starting from the top line down going to the next as each error is fixed.
Linearisation Table examples
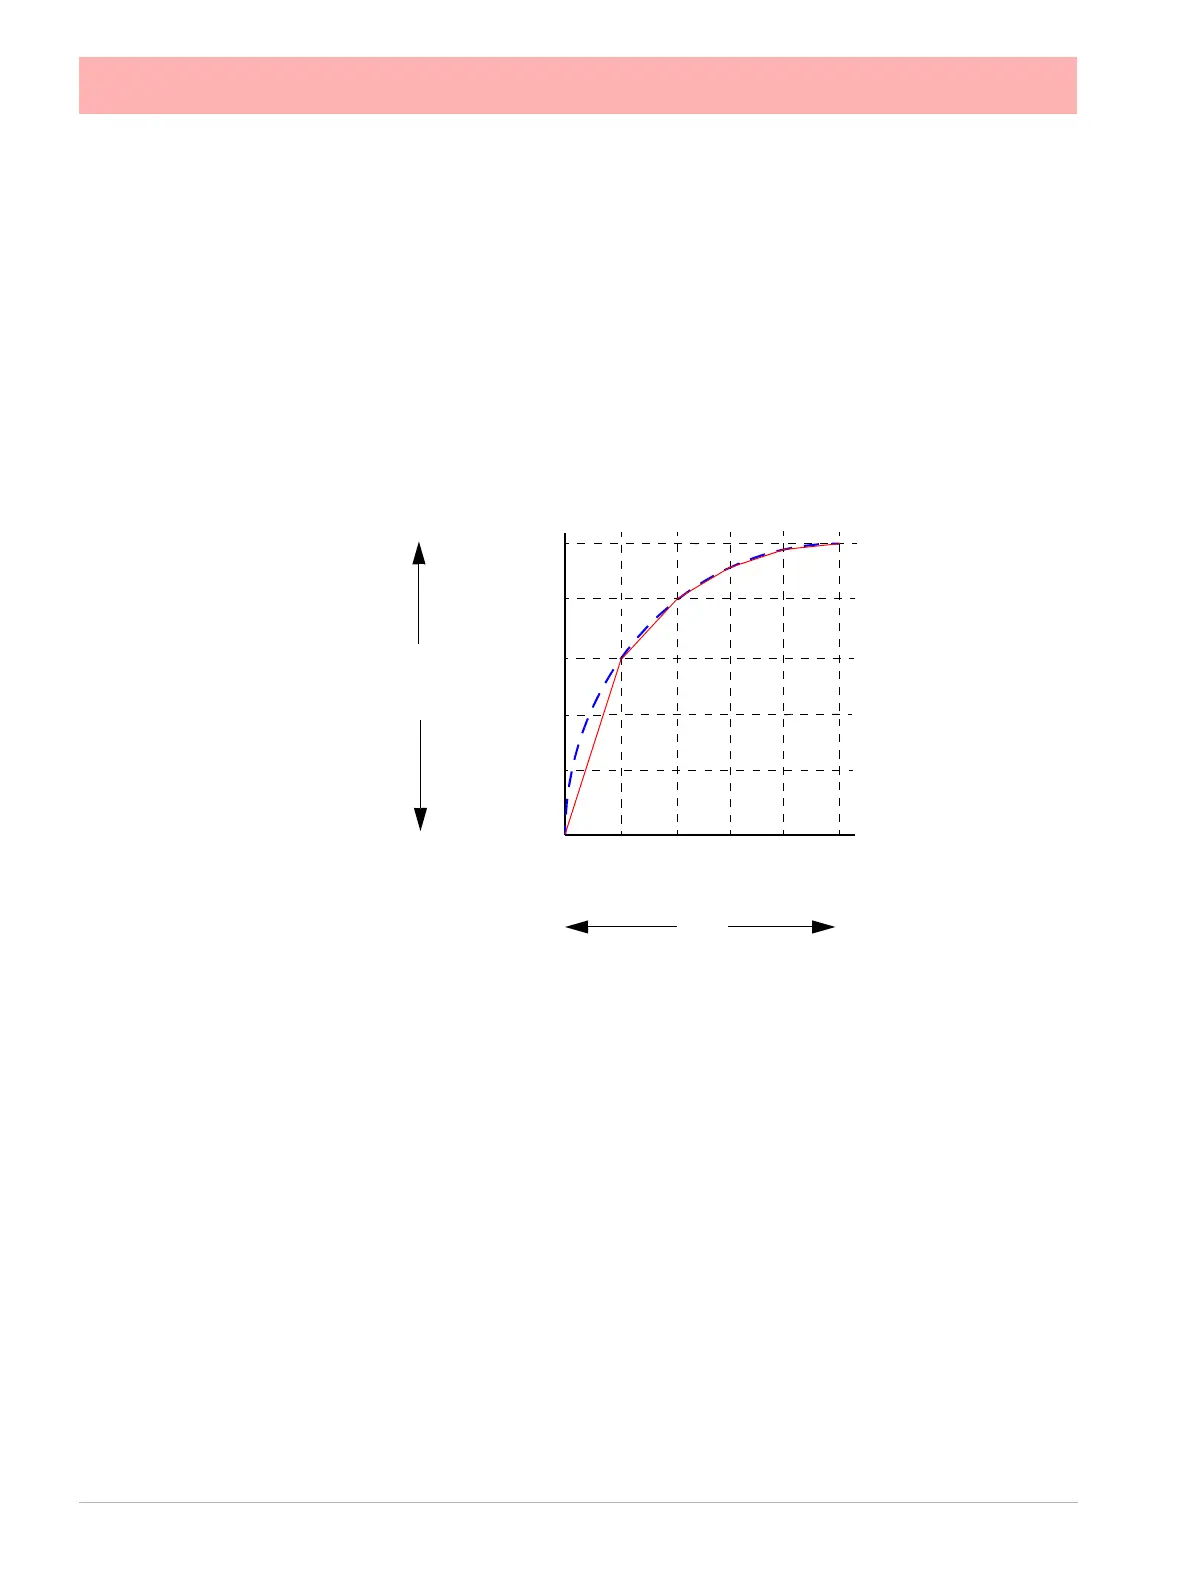
Figure 4.3 shows an example of a set of non linear signal inputs (X) and the required values
in engineering units (Y) that have been entered into a linearisation table. They would pro-
duce the following curve.
A straight line is drawn between each point, as shown by the continuous (red) line in Figure
4.3. For a more accurate curve, as shown by the dotted line (blue), add more data points
into the linearisation table.
The Linearisation tables that you set up here can then be used in the “Analogue In Menu”
on page 54
If the full input range is greater than the range used in the linearisation tables then the signal
will carry on following the slope of the last two inputs. For example if we had a -50 to +50V
range and just used the 0 to 10V linearisation table then the signal would look like Figure
4.4.
0 2 4 6 8 10
0
2
4
6
8
10
X
(Signal Input)
Y
(Eng. Units)
Figure 4.3 Example of a 0-10V non-linear input signal
 Loading...