230 43-TV-25-30 Iss.6 GLO Aug 07 UK
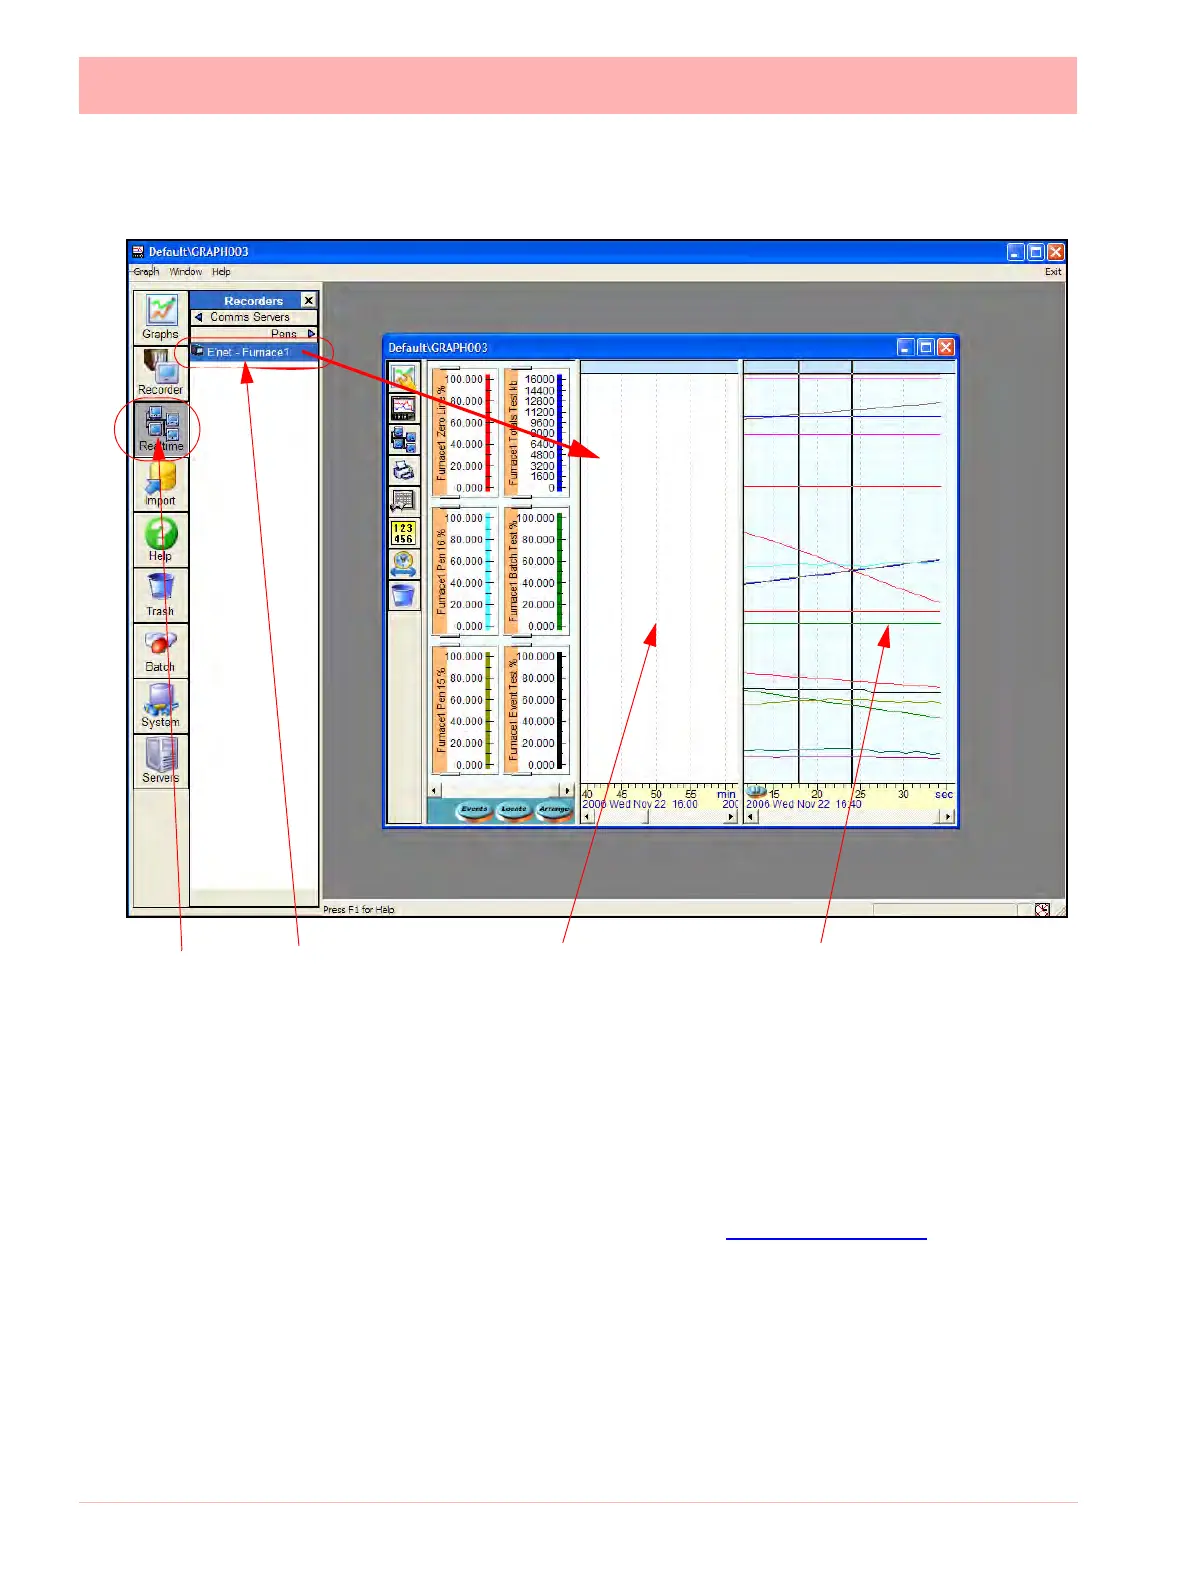
The white area for historical data will display the data that is stored to the database. At this
point we have no data being stored to the database, it is simply being acquired and graphed,
if the graph is closed any data downloaded via Modbus will be lost.
More information about graphing on TrendServer Pro and the options for arranging pens
etc. are available in the TrendManager Pro software manual for this product. If this doc-
umentation is unavailable it can be downloaded at
www.XSeries-info.net.
The blue background area
is the real time data.
The white background area
is the historical data.
Realtime
button
Modbus
recorder
Drag and Drop
Recorder from
the list onto
the graph area
Figure 8.9 Realtime Graphing
 Loading...