298 43-TV-25-30 Iss.6 GLO Aug 07 UK
Because of this small, but increasing contribution to F
0
once T reaches 100 ºC, and the fact
that in this trace the temperature exceeds 121.11ºC, the F
0
value reaches 15 at time t = 20
minutes, at which point the sterilisation is complete, and cooling begins.
For some applications it is allowed to report the F
0
value that is finally achieved as
the sample cools back to the start temperature, in this example 100 ºC, and so the
contribution under the curve up to t = 22 minutes would be included in the reported
F
0
. The final F
0
value might then be 16.1, say, with 15 having been achieved up to t =
20 minutes, and the extra 1.1 having accumulated during the cooling back to 100 ºC
between t = 20 minutes and t = 22 minutes.
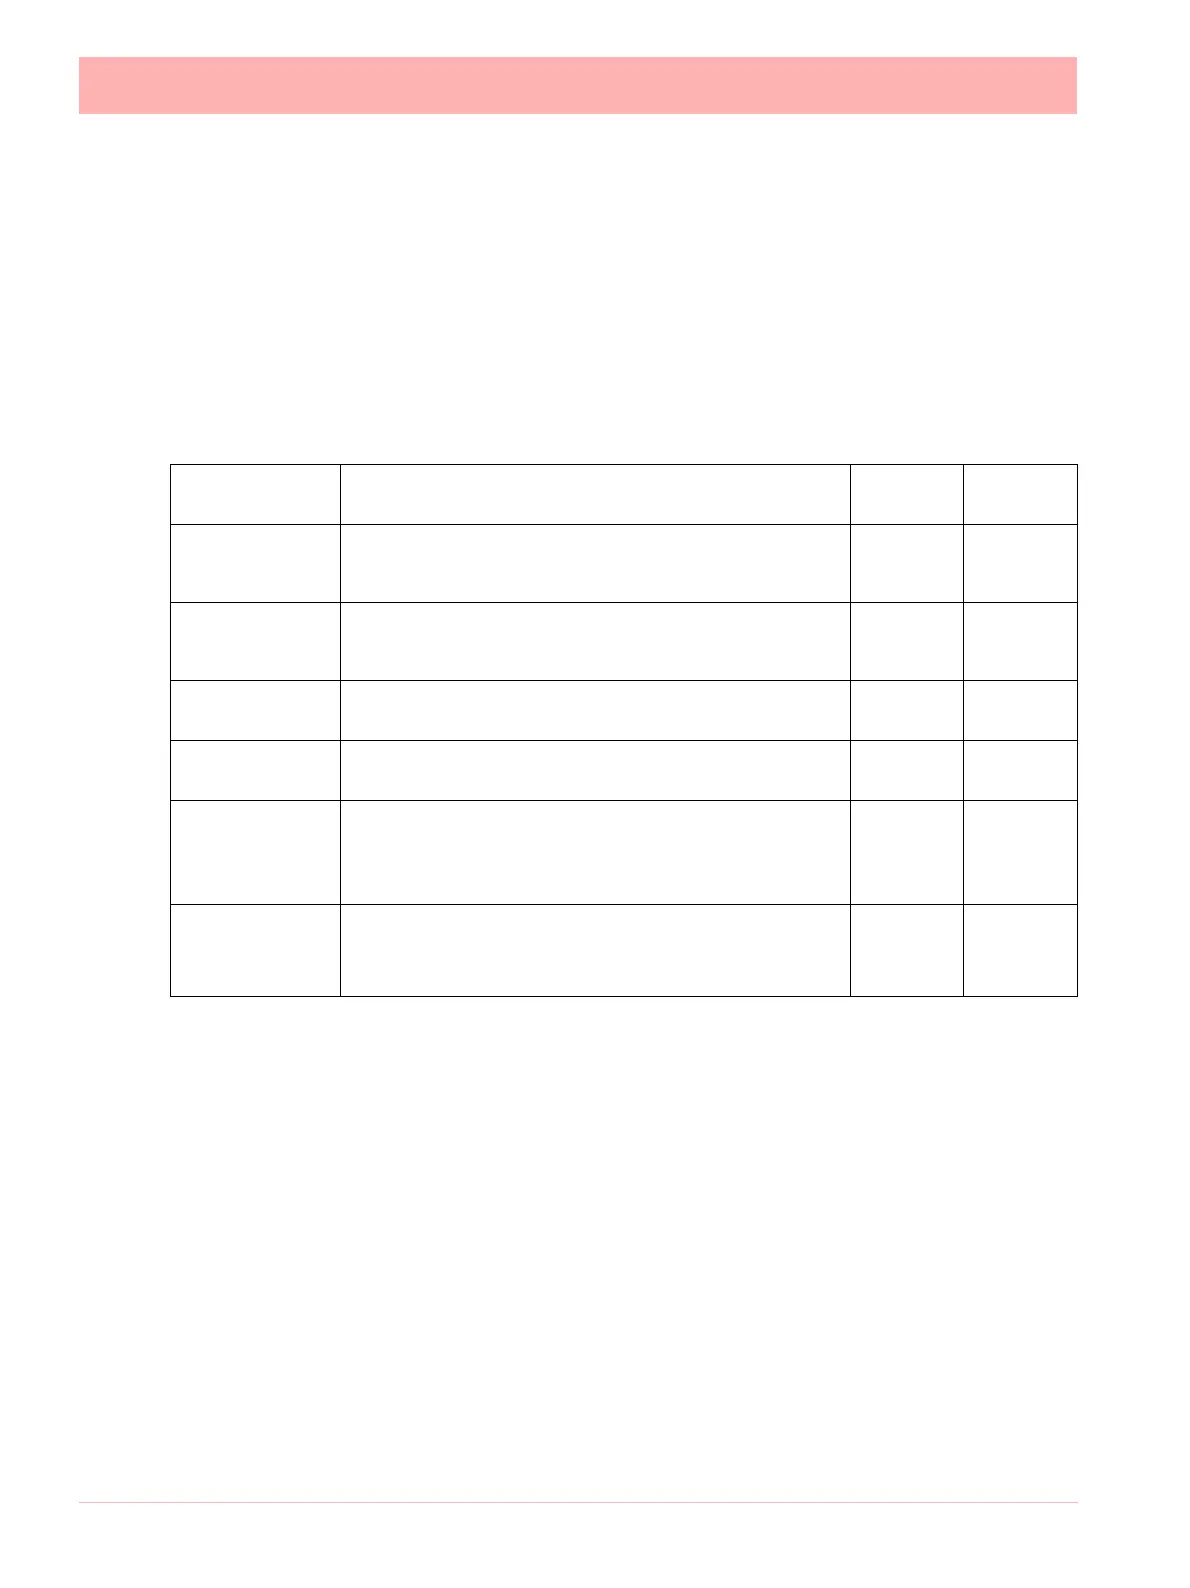
The terms used in setting up the F
0
totaliser, together with their default values, are summa-
rised in this table.
For setting up the Fo calculation refer to the “Totaliser Menu” on page 70.
Term Definition Default
values
Allowed
Range
F
0
The equivalent time in minutes at 121.11ºC that would pro-
duce the same degree of sterilisation. This is the totaliser out-
put value
z factor
The temperature increase in ºC above the reference tempera-
ture that will produce a 10-fold increase in the rate of sterilisa-
tion
10 5 - 20
Start
temperature
The temperature in ºC above which the contributions to F0
can be counted
100 90 - 120
Reference
Temperature
The reference temperature for sterilisation, normally
121.11ºC, can be altered if required.
121.11ºC
Include
cooling phase
If TRUE, contributions to F
0
can be included after the target
value has been reached and while the temperature is still
above the start temperature. If FALSE, these contributions are
not included
FALSE -
Completion
Value
The maximum F
0
totaliser value can be set if “Include
cooling phase” is not selected, the totaliser will stop at
this value of F
0
.
15 1 - 999
 Loading...