Chapter 1 Getting Started
Making Measurements
1-34 Operating Guide
1
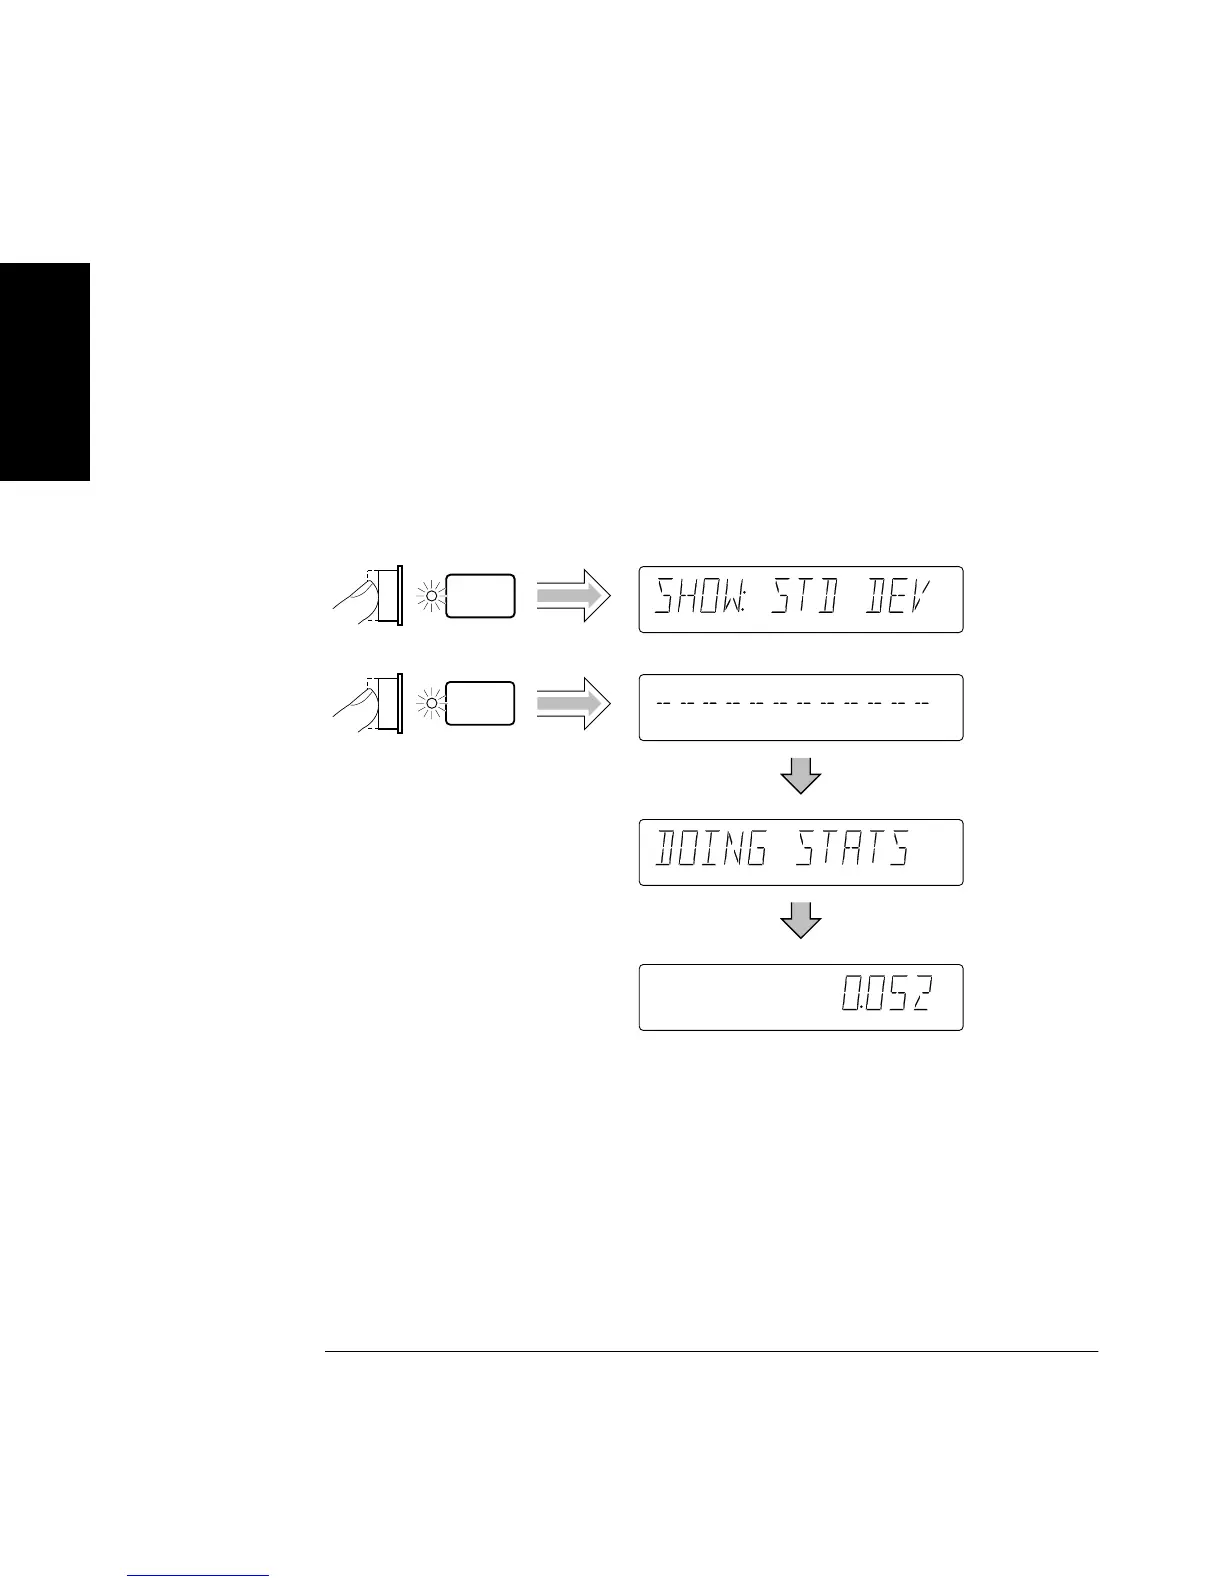
Displaying Stats After Filtering Data of Input Signal
Let’s assume you have set the upper and lower limits for the input signal,
and selected the IN LIMIT (filtering) choice. Now, perform the following
steps to display the standard deviation of the filtered measurements.
(Note that the first step in the following procedure is optional since you
should have already set Stats to show standard deviation at the beginning
of this Stats procedure. But, you may want to perform the step anyway to
verify that the Counter is displaying the standard deviation of the
measurement.)
The standard deviation value shown in the previous illustration is for
demonstration purposes. The statistic is computed using only those
measurements which fell within the limits you set.
(For more details on the Stats and Limits functions, refer to the
appropriate sections in Chapter 2, “Operating Your Universal Counter.”)
Now, disable Math and Stats as shown in the following procedure.
Display 1, 7/13/92
Stats
Run
Freq Ch 2
Gate
Freq Ch 2
Gate
Freq Ch 2
 Loading...