Chapter 4
Autotesting
4-21
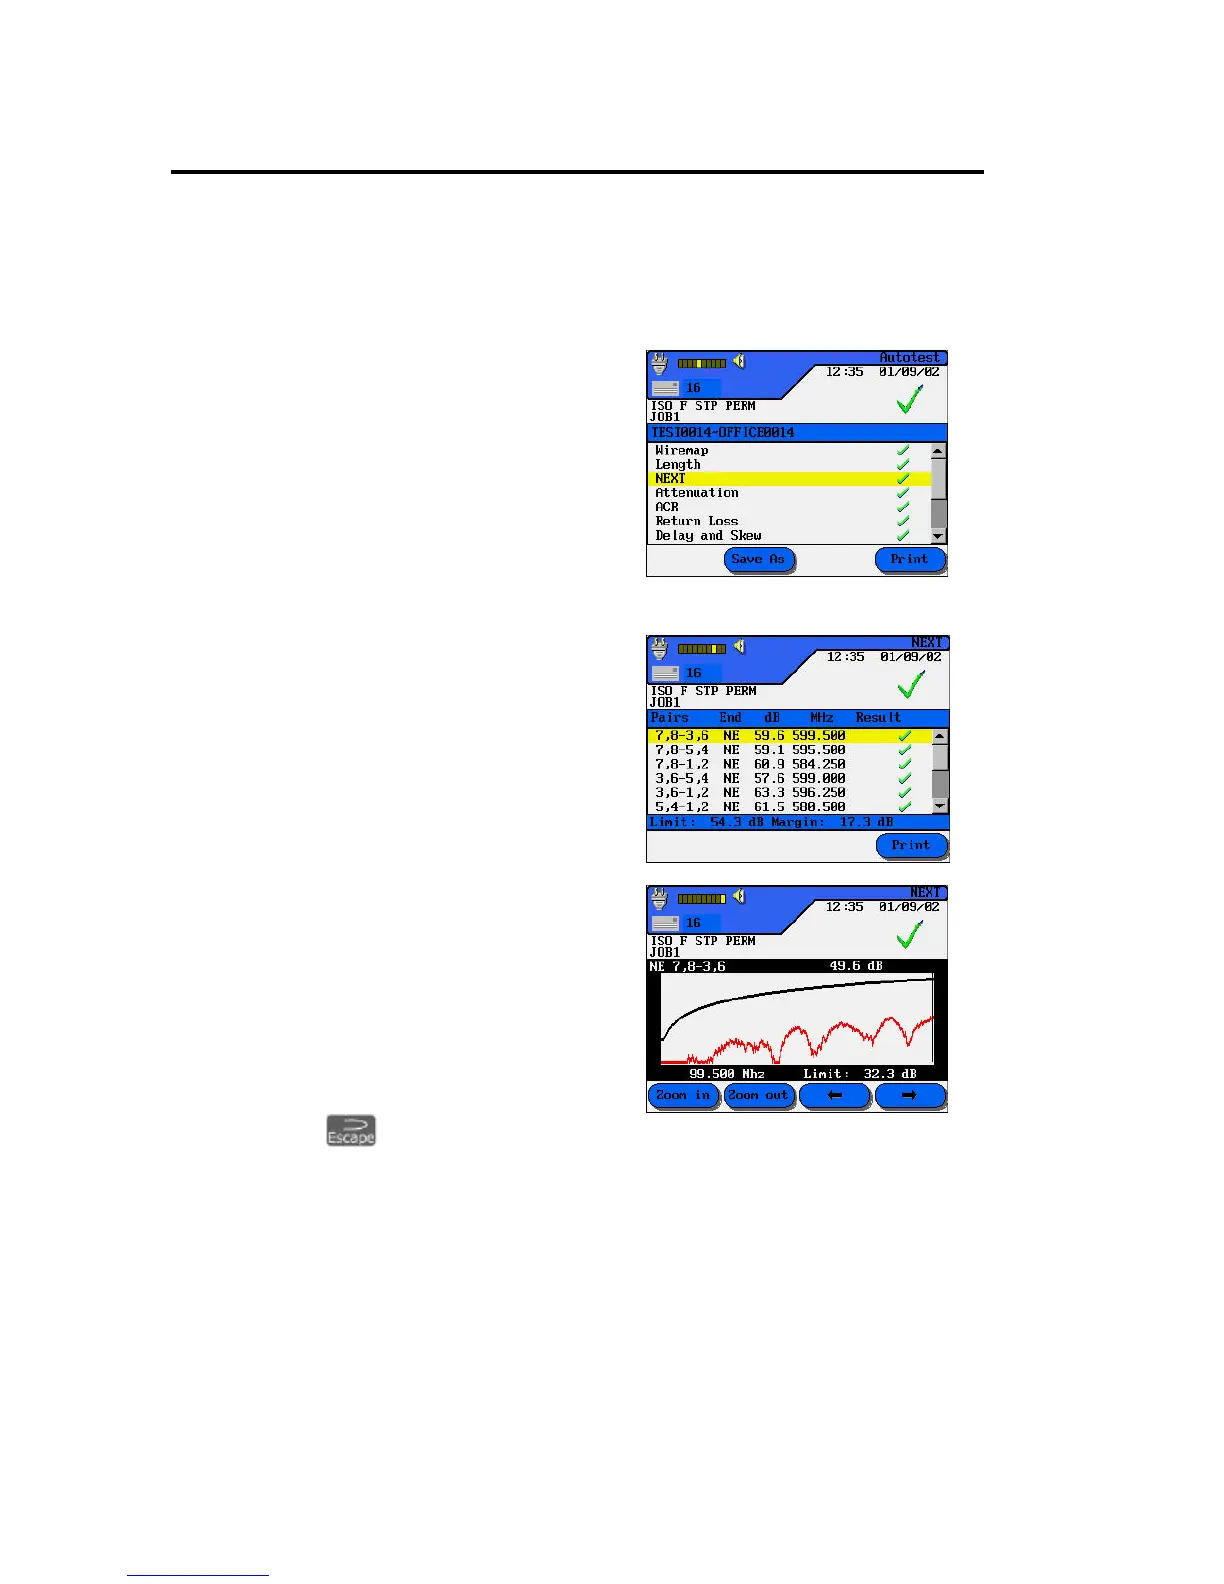
To view an Autotest graph:
1. Configure the Autotest Preferences (Refer to Page 4-9).
2. In Autotest Preferences, make sure the Save Graphs checkbox is selected.
3. Press Autotest. Upon
completion of the test suite for
the cable type selected, the
Overall Autotest results screen
displays.
4. To display tabular data,
position the cursor on the
desired test result (the NEXT
test) and press Enter.
5. To display a graph of the
tabular data, position the
cursor on the tabular data of
interest (pairs 7,8 and 3,6) and
press Enter.
6. The graph will always open
with the cursor positioned on
the worst case margin. In this
example, the cursor is
positioned on the horizontal
axis at 99.50 MHz.
7. Press to return to the previous screen.

 Loading...