Chapter 4
Autotesting
4-23
Note: The margin data at the bottom right of the Tabular screen represents the worst
case difference between the actual measured data and the predefined limit
threshold as shown by the cursor position in the graph on the right.
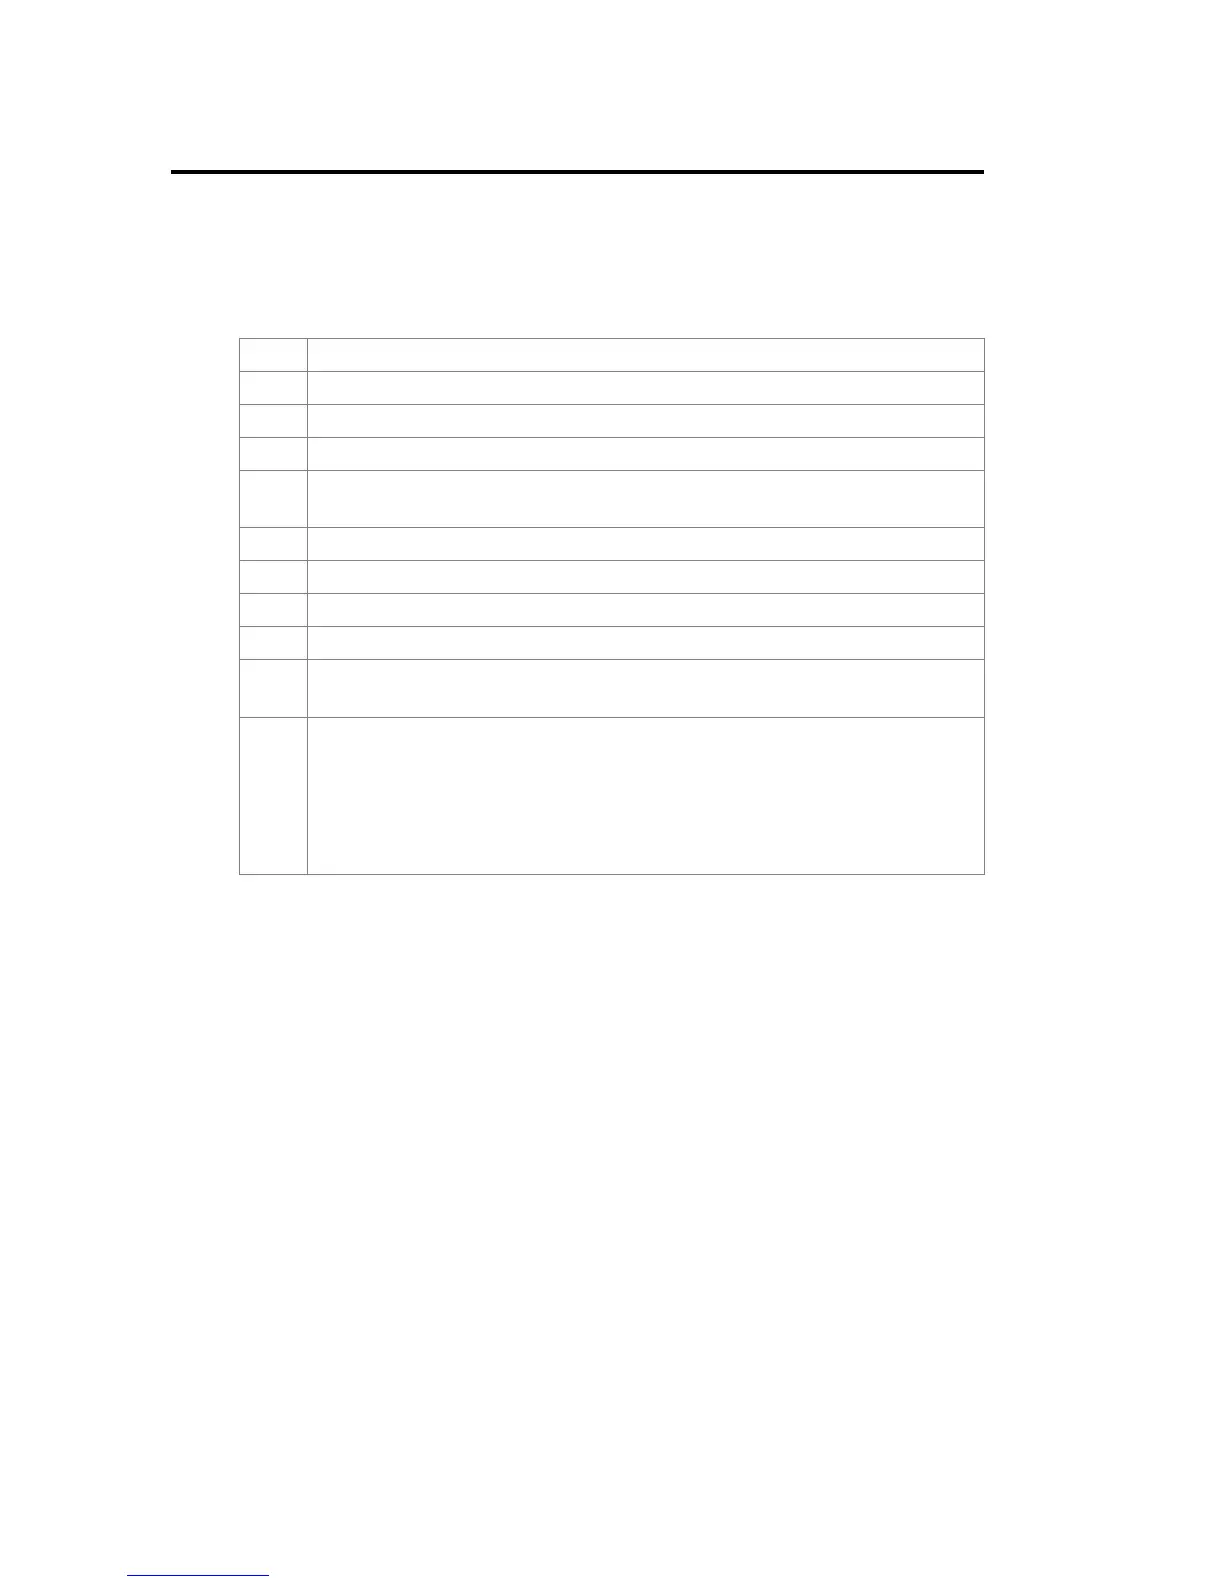
Table 4-6: Autotest Graph View Layout and Controls
Item Function
1 Wire pair plotted from tabular data.
2 The horizontal axis represents frequency data.
3 The vertical axis represents measurements in dB.
4 When a wire pair graph is first displayed, the cursor is automatically positioned
at the worst case limit and frequency point.
5 Actual data plot for a wire pair. Attenuation is plotted in this example.
6 Predefined worst case limit plot for attenuation.
7 Predefined worst case limit plot for NEXT.
8 Actual data plot for a wire pair. NEXT is plotted in this example.
9 Expands or compresses the horizontal axis of the graph. At full magnification,
this key becomes inactive.
10 Arrow keys are used to move the cursor horizontally. As the cursor moves,
screen readouts will change to reflect cursor position.
Moving the cursor:
• Use the soft keys to move the cursor in larger steps.
• Use the key pad keys to move the cursor in small steps.
 Loading...