Chapter 3
Calibration, Configuration, and Special Operations
3-48
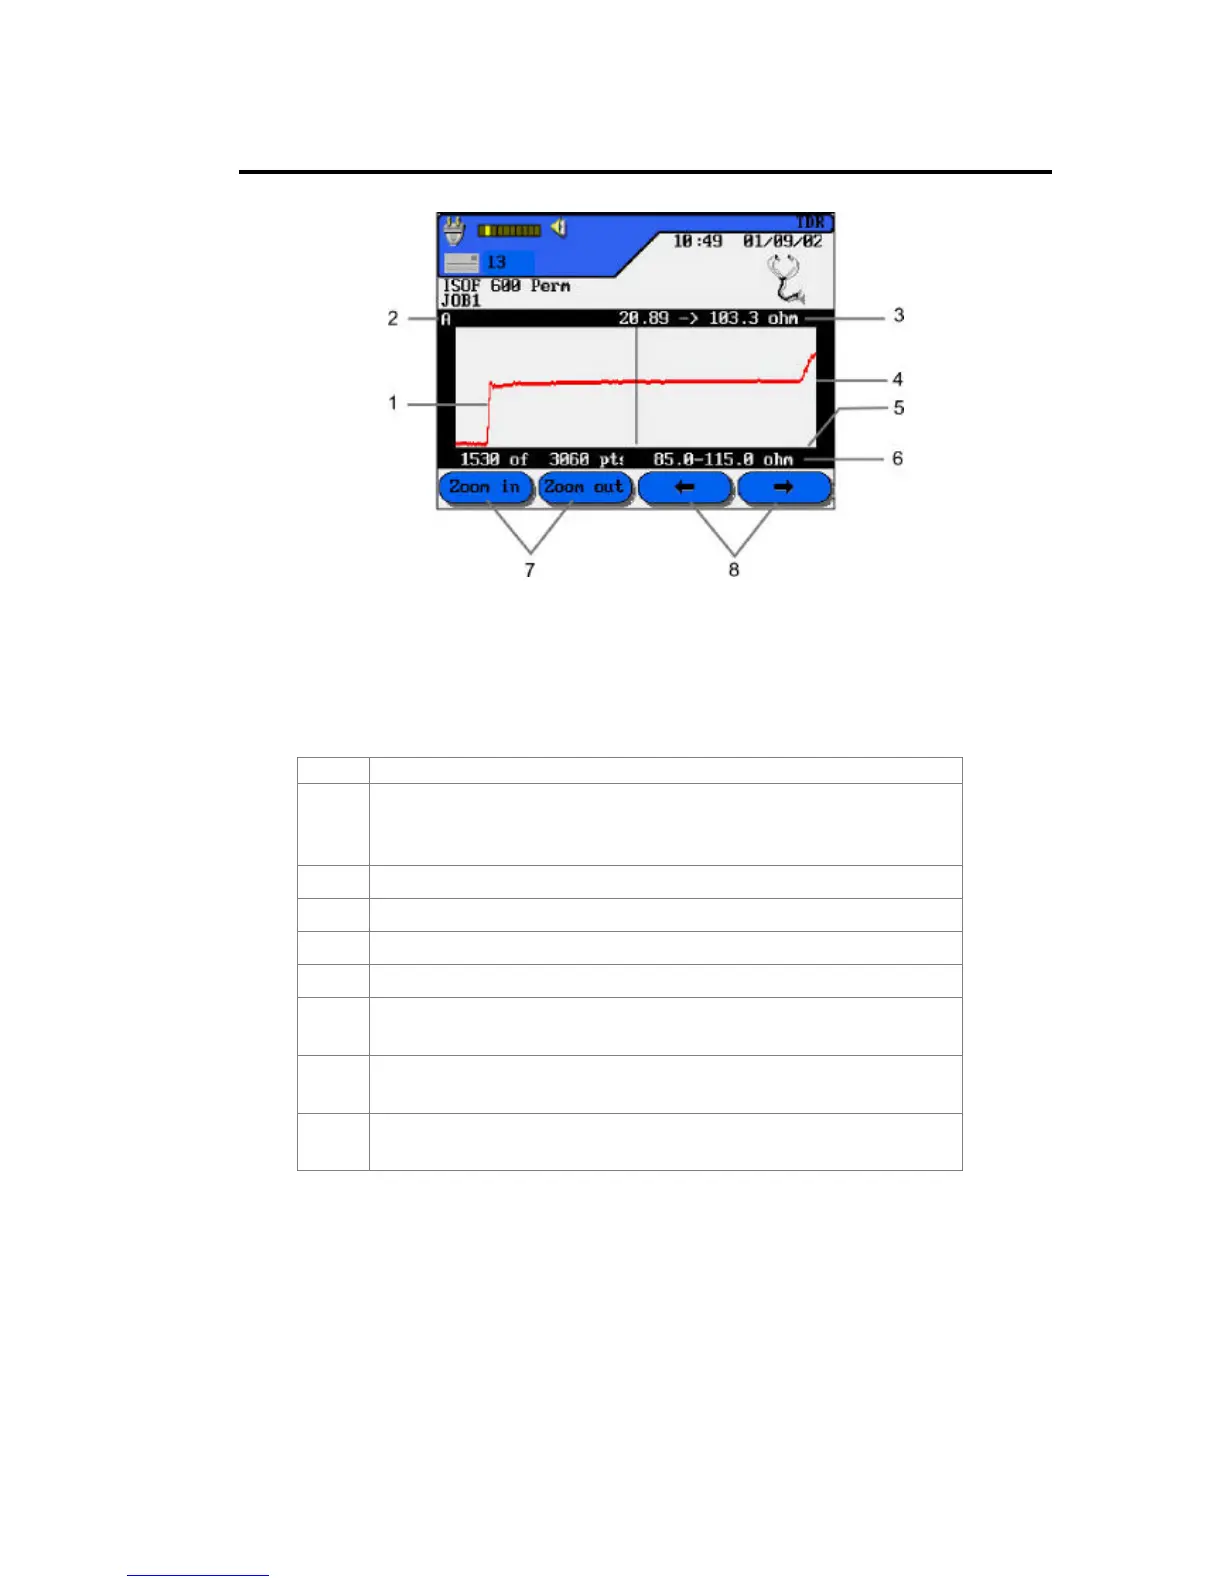
Figure 3-6: TDR Graphical Plot Layout and Controls
Note: TDR graphs do not have a tabular view option
Table 3-6: TDR Graphical Plot Layout and Controls
Item Function
1 Actual TDR data plot for a wire pair. When a wire graph is first
displayed, the cursor is automatically positioned at the midpoint of
the data.
2 Designated wire pair plotted from TDR data. (Pair A, B, C, or D)
3 Distance in meters or feet and impedance value at the cursor.
4 The vertical axis representing percentage of reflection data.
5 The horizontal axis representing distance data.
6 Distance of cursor vs. total length measured in points and associated
measured levels of impedance.
7 Zoom out/Zoom in keys to expand or compress the horizontal axis of
the graph at the cursor.
8 Arrow keys are used to move the cursor horizontally; the screen data
displayed will change to reflect the cursor position.
 Loading...