Chapter 4
Autotesting
4-20
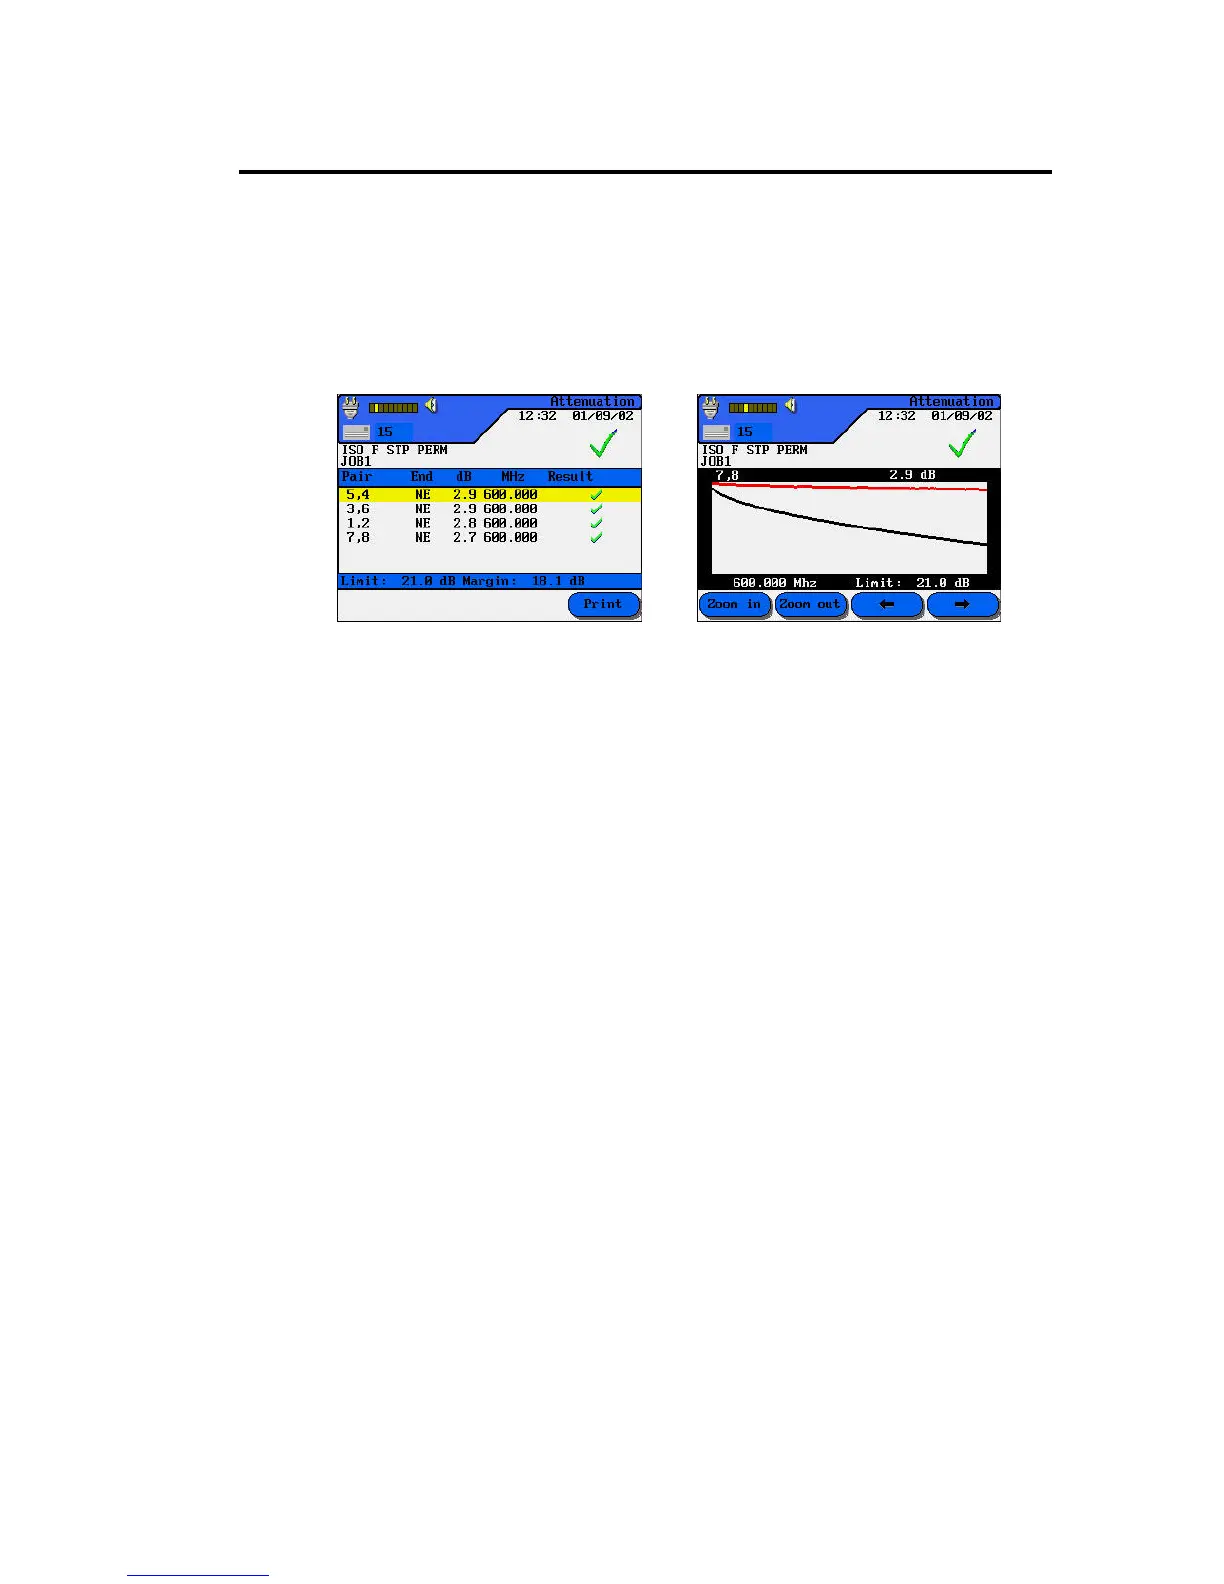
Autotest Graphs
Autotest results can be viewed at the completion of the test sequence in either a
tabular or graphical format.
Tabular Format Graphical Format
Graphing Facts
Graphs can be very useful for viewing test results. There are a few things you need
to know before you start using them:
• In Autotest Preferences, you can set your tester to include and save graphs
with test results. (Save Graphics is the factory default.)
• To save Autotest Results and graphs, use external storage media (Flash Card
and/or PC)
• The limit and worst case margin parameters are always displayed at the bottom
of the tabular test screen.
• When you go to graph view, the vertical cursor is always placed at the worst
case margin location.

 Loading...