Chapter 4
Autotesting
4-22
Graph Formats, Layouts, and Controls
Graphs are useful for observing the relationship between two network cable
parameters, actual measured parameters and predefined worst case margins.
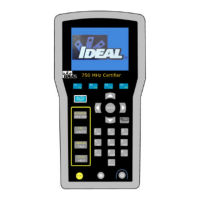
There are two different graph formats: single and dual plot.
Single Plot Dual Plot
Layout and Controls
The horizontal axis represents frequency data and the vertical axis represents the
measure values in dB, with limits indicated as a solid line trace.
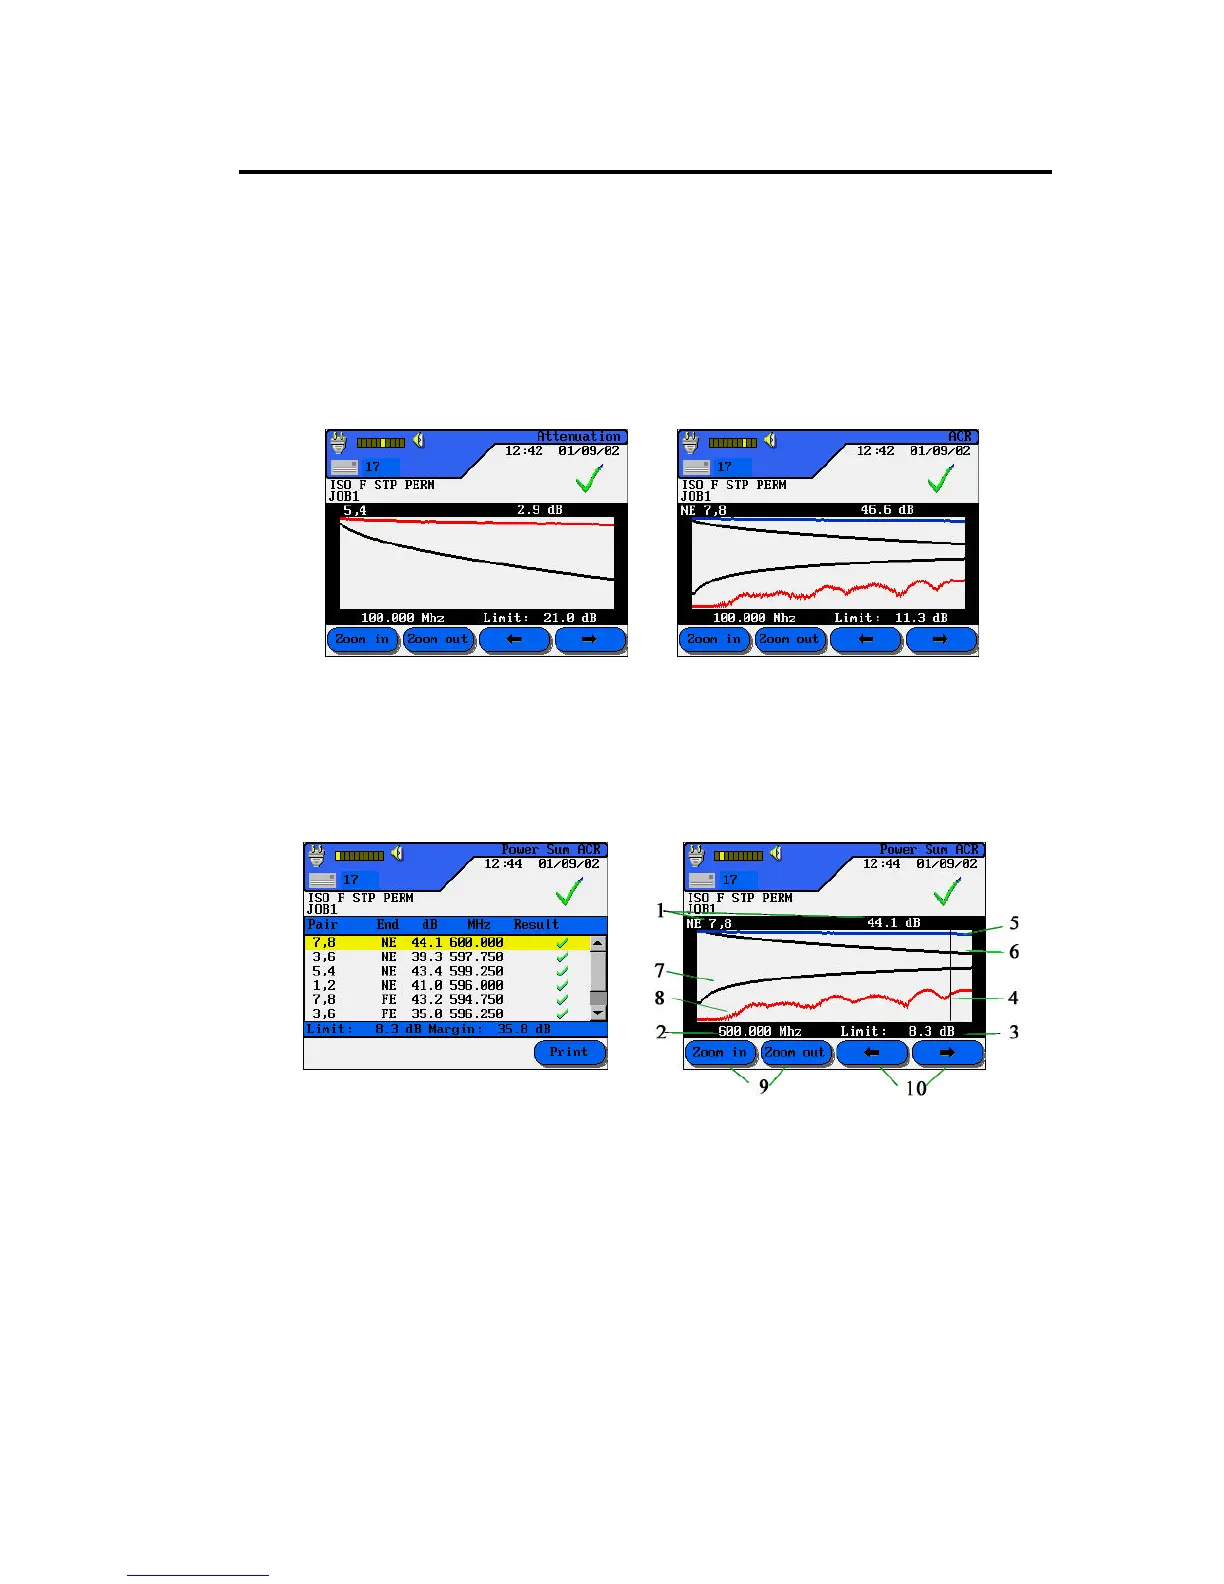
Tabular View Graphical View
Figure 4-1: Tabular Data and Graphical Plot Layout
 Loading...