Chapter 3
Calibration, Configuration, and Special Operations
3-47
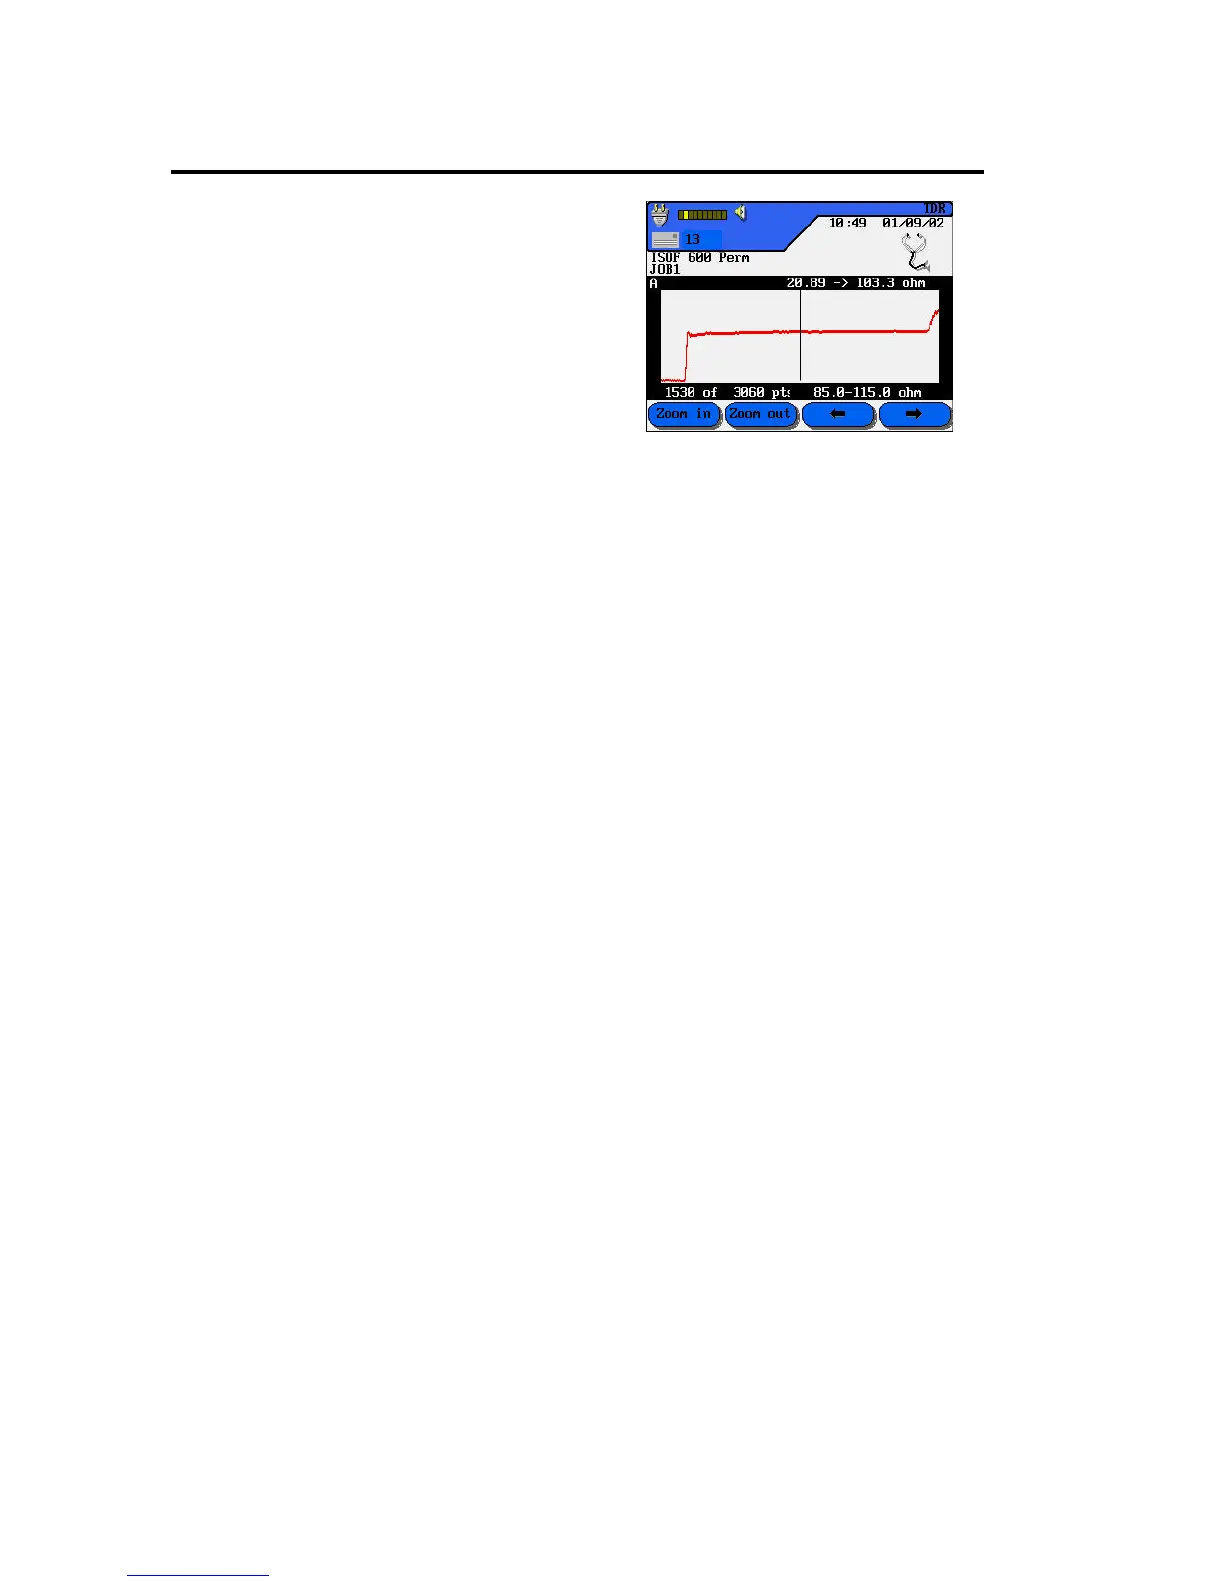
4. At the completion of the TDR
test, a graph is displayed.
Note: The TDR function is not
available through custom cable
settings.
The TDR Plot
The TDR graph is an image of the structure of the cable under test along its entire
length, up to a limit of 2000 feet (609.6 meters). This graph shows anomalies by
displaying blips, peaks, or valleys on an otherwise flat line.
TDR Plot Layout and Controls
The horizontal axis represents distance data and the vertical axis represents the
percentage of reflection.
 Loading...